
By Dr. Dean G. Fairchild E-mail dfairchild@hypercommunication.net

By Dr. Dean G. Fairchild E-mail dfairchild@hypercommunication.net
Introduction
Population density alone does not explain such differences in production scale or the enormous variation in profits and pricing. In short, the hypercommunications marketplace in Florida fits Chamberlain's pattern of "markets of different sellers" that "fit together in highly irregular fashion". Chamberlain's original analysis applied to the location problem where retail or wholesale customers travel to a seller's store to shop and buy. Sellers had two economic objectives. The first objective was to select the best store locations given a specific density of customers. The second objective was to discover what product mix would maximize the sales and profits of each location. Customers, in turn, would be "pulled" into visiting the store with the best combination of location and product mix.
In hypercommunications, since a physical wireline circuit (or wireless path) is required, the store location problem becomes a POP (Point of Presence) location problem with additional complications. Bandwidth (communication capacity), data rate (communication speed), and QOS (communication quality) are directly delivered to customers. Figure 6-1 illustrates this by showing the organization of Chapter 6 and Chapter 7 and their interrelationship.
Two parts of the figure come from material presented in earlier chapters. The QOS reference model (at the top) and the conceptual model (at the bottom) weave a context for Figure 6-1 so that the organization of the chapter into five sections is easier to follow. The QOS reference model (from Figure 4-14 in 4.2.3) separates hypercommunications into access, transport, and CPE (Customer Premises Equipment) at agribusiness locations one and two.
The access level is an electronic pipeline that has been (or has to be) built from a transport carrier's POP to each customer (or cluster of customers) in the form of wires, cables, or wireless transmission equipment. The transport level transmits large amounts of information over long distances at low cost to the POP that serves the second agribusiness location. All forms of hypercommunication (telephone calls, e-mail, faxes, data, enhanced telecommunications, and Internet traffic) travel from the sender over an access level, through a transport network, and over another access level to reach the recipient. This is also true when location #2 is a customer or vendor instead of another office. Note that each agribusiness location uses a separate access level based on the access technology and location to reach the transport network.
The POP connects the physical access level (usually built and operated by a specialized carrier called an access provider) with a physical and virtual transport level or carrier network (often operated by another carrier). Open access from any access provider to any competing transport networks can encourage competition at the access level (leading to more and better communications being sold for successively lower prices) as the section on positive network externalities (3.7.2) suggested. However, as the section on negative network externalities (3.7.3) also suggested, unless the costs of the access level are somehow recovered, open access can lead to congestion and other costs not reflected in market prices. Hence, hypercommunication sellers (such as access providers and transport carriers) cannot simply build stores and recover costs when customers visit, they must build an infrastructure to the customer, recovering their costs through an installed customer base.
Recall from Chapter 2 that the hypercommunication network combines the mass and interpersonal communications models into a mesh network that can carry messages ranging from telephone calls to live video auctions. For convergence to occur, two things must happen. First, high-speed, high-capacity access loops must be available to connect users to POPs that second, are capable of replacing the old separate transport networks of the PSTN (Public Switched Telephone Network), the Internet, and private data networks. In the simpler retail store example, buyers pay a cost in time and money to travel to a store that is optimally situated from the store's point of view. However, hypercommunication access providers and transport carriers incur costs of physically connecting to their customers.
However, a transport carrier need not build the costly access level itself to connect prospective customers with its POP. Cooperation between two hypercommunication firms (an access carrier and a transport carrier) may be required to build a communications path to a prospective customer.
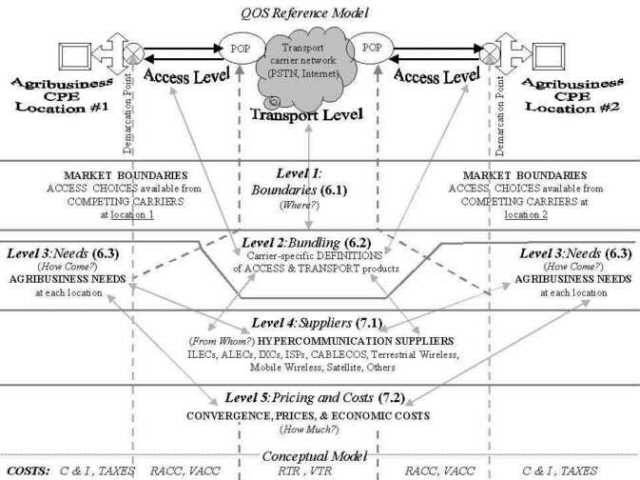
Figure 6-1: Organization of Chapter 6 and Chapter 7 with interrelationships between chapters.
An important feature that carries through the figure from top to bottom is the demarcation line that separates CPE owned by the agribusiness from carrier equipment. The demarcation line represents the end of the agribusiness' local network and the beginning of the access level (also called the local loop or last mile). Again, the hypercommunications marketplace differs from the store location example because (in addition to the access provider and transport carrier), the agribusiness must make an investment of its own before it can buy access or transport.
The bottom line in Figure 6-1, labeled COSTS is the conceptual model (Equation 5-1 from 5.6.1). Agribusinesses pay several separate costs for hypercommunications as described by the variables of the model shown: C&I, TAXES, RACC, VACC, RTR, and VTR. C&I stands for the cost of CPE and installation for the equipment needed by an agribusiness to hypercommunicate. C&I normally includes hardware, software, and services on the agribusiness' side of the demarcation line. Access level costs are divided into RACC (Recurring Access Costs) and VACC (Varying Access Costs). Similarly, transport costs are divided among RTR (Recurring Transport Costs) and VTR (Varying Transport Costs).
Recurring costs are most often charged on a monthly basis and are classified as NTS (Non-Traffic Sensitive) since they do not depend on the amount of hypercommunications traffic generated by the agribusiness. Varying costs are TS (Traffic Sensitive) and may be incurred on minutes, kbps, or other units. TAXES include ad valorem, per unit, indirect, and compound taxes and regulatory fees as specifically described in 5.5 and more generally covered in 5.6.4. TAXES may apply to any of the other costs. However, because they depend on the service location of the agribusiness, they are shown with the C&I cost on the agribusiness side of the demarcation line.
Three of the five levels between the QOS reference model and the conceptual model form the sections of Chapter 6. The first, market boundaries (6.1) are specific to each agribusiness' location. The market boundary for a given location represents the choices an agribusiness has from competing carriers for access to hypercommunication networks. Market boundaries answer the question of where access to high-speed hypercommunication network is available. The section shows how regulatory factors and technology-based infrastructure differences (telephone, cable, and fixed wireless technologies have different ranges from customer to POP) combine to create thousands of different local markets in Florida.
The second level, bundling, is covered in 6.2. Linkages among levels are shown throughout Figure 6-1 to underscore the point that access costs and transport costs may be combined under certain bundles with certain carriers, but priced separately for others. Bundling refers to how access, transport, and other hypercommunication services are often defined as composite goods and priced accordingly. Since hypercommunications is such a complicated subject, bundling can be used to simplify decisions so customers do not get lost in minutiae. However, in practice, bundling also can make comparisons between technologies or among carriers more difficult.
The third level in Figure 6-1 focuses on the unique hypercommunications needs of agribusinesses, contained in 6.3. Specific communication needs are behind the agribusiness manager's question, "How come my agribusiness needs hypercommunications?" The diversity of products handled by Florida agribusiness, an agribusiness' position in marketing channels, span of control, and desire to do business globally are sources for many differences in "Who?" needs hypercommunications the most among agribusinesses. Many of the reasons for agriculture's uniqueness are sources of communication needs as well.
The fourth level of Figure 6-1 concerns hypercommunication suppliers. Hypercommunications supply depends on the number, size, and channel position of firms, the conduct and performance of industry players, and regulation. Questions such as "From whom?" an agribusiness should buy and "When?" to change carriers or upgrade CPE to take advantage of converging networks are answered in an agribusiness' choice of hypercommunication suppliers. Details such as "When?" a particular service will be available, and "Who?" (among hypercommunication suppliers) will offer it to a particular location are not easily answered on a statewide basis. Suppliers are covered in section 7.1 along with general guidelines agribusinesses can use in evaluating hypercommunication suppliers.
Section 7.2 (the fifth level) considers convergence, prices, and economic costs to analyze the question of "How much?" an agribusiness should pay for hypercommunications. Specific pricing details for services and technologies change so rapidly and depend so much on competitive pressures in the local markets that too detailed an analysis would become rapidly outdated and could never cover every geographic area. Thus, 7.2 will give broad ranges of accounting prices and make a special effort to discuss certain less obvious (but perhaps more important) economic costs through the conceptual model and an accompanying decision tree.
Technical details that have been left out of Chapter 6 (to retain an agribusiness focus) may be found in other chapters. Because of the complexity of hypercommunications, readers may have to consult technical details in Chapters 3 or 4 or be at a disadvantage. Understanding pricing also depends on an understanding of the asymmetries of taxes and regulatory charges (as discussed in Chapter 5) which can total thirty percent of the bill (or higher) for some hypercommunication services. A key to abbreviations and acronyms is provided to help with the alphabet soup of acronyms and a glossary to help with the sea of jargon that accompanies making business decisions about hypercommunications.
6.1 Boundaries Within Florida's Hypercommunication Marketplace
Boundaries define markets. As an agribusiness shops for hypercommunication services, one of the most important tools for decision making is to understand how markets are physically defined. Boundaries are important because in order to buy with hypercommunications, two things must occur. First, sellers must bring services to buyers via an infrastructure, called the access level in Figure 6-1. Second, buyers must have their own infrastructure (CPE) that is compatible with the seller or carrier's network and capable of handling traffic at every agribusiness location. An agribusiness may do business at fixed locations such as branch offices, or warehouses, as well as in nomadic or mobile locations such as fields, customer locations, salespeople's homes or cars, and trade shows. Locations can be in Florida, national, or international.
Since sellers must bring services to buyers various boundaries are set by technology, government, and competition among carriers. This results in the compartmentalization of Florida's hypercommunications market in practice although in theory convergence should eliminate many boundaries. As Mark Jamison mentions " . . . basing communications policies on boundaries --- whether they be geographic, technological, or something else --- isn't sustainable. And changing the boundaries is often politically difficult if not impossible." [Jamison, February 1997, p.1]
The Internet is a good example of how new technologies are altering traditional boundaries as Werbach notes:
Furthermore, Werbach is speaking of regulatory boundaries rather than technical boundaries. Hypercommunications boundaries are of two main types, technical (6.1.1), and regulatory-political (6.1.2). Technical and regulatory-political boundaries (combined with competition for territory by different carriers) create the irregular market boundaries (6.1.3) faced by Florida agribusinesses.
Technical boundaries are based on the underlying transmission technology, electrical engineering, and laws of physics. Technical boundaries affect the transport, access, and CPE levels in the QOS reference model (top, Figure 6-1). Many technical boundaries were covered in Chapter 4. These include wireline conduit ranges (Table 4-7), network protocol efficiencies (Table 4-27), signal conversion and transformation (Figure 4-2), properties of the electromagnetic spectrum (Figures 4-30 through 4-34), and the range of T-1 line codes (Figure 4-44). While the Internet, fiber optic conduit, and other technologies have led to greater flexibility in boundaries at the transport level, methods of network access must still obey the laws of electrical engineering and transmission that create technical boundaries. In general, technical boundaries depend on the carrier and the carrier's equipment, service type, and the agribusiness' CPE.
Technical boundaries vary by the type of access technology as implemented by a particular carrier. This statement can be supported by showing typical coverage areas for several kinds of technologies: mobile 3G (Third Generation) wireless, fixed upperband wireless, wireline DSL, cableco service areas, fiber optic routes, and Internet tier-one connection locations. Examples of several kinds of these technical boundaries are shown in Figures 6-2 through 6-8.
The first coverage area, shown in Figure 6-2, is for two-way GSM mobile 2G wireless in the Tallahassee area [FCC 00-289, 2000, Appendix H]. Note that the very darkest areas (four distinct sites ringing Tallahassee) are enhanced coverage zones where high two-way data rates are supported for mobile users, while the lighter areas support basic mobile telephone service only. Wireless Internet access and two-way data rates of 384 kbps to 1.5 Mbps can be obtained only in the darker areas shown. Users in outlying areas, shown in moderate gray are able to use only mobile telephony service rather than two-way text and data communication. Even further out, in the lightest gray areas, no service is obtainable at all from the company.
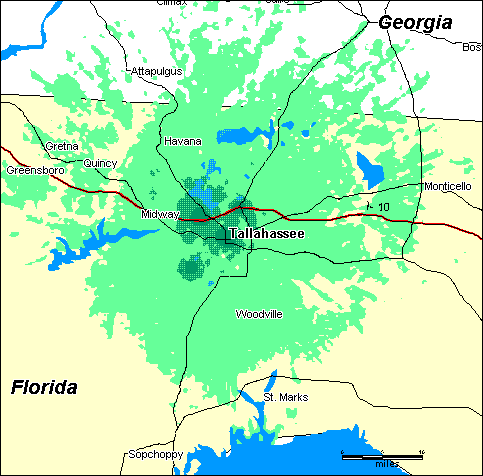
Figure 6-2: Mobile two-way 2G wireless coverage in Tallahassee area.
Two-way high-speed paging coverage areas for Arch Communications in South Florida are shown in Figure 6-3 [FCC 00-289, 2000]. With the exception of Lake Okeechobee (dark gray), other dark gray areas are extended service areas where two-way pager users may send and receive text and voice pages from anyone with e-mail or POTS service. However, in lighter gray areas, only basic one-way paging is available. Service is not available at all in white areas.
The next technical boundary shows the range of two-way fixed wireless. In this case, the system is the Airwire MMDS system as implemented in the Orlando-Space Coast area as shown in Figure 6-4 [FCC 00-289, 2000]. Figure 6-4 shows varying degrees of MMDS coverage intensity. The darker the circle, the better MMDS coverage is. For example, users in Palm Bay and Indian Harbor Beach (dark areas) obtain higher data rates and better system reliability than do users near Sanford or northwest of Titusville (lighter areas).
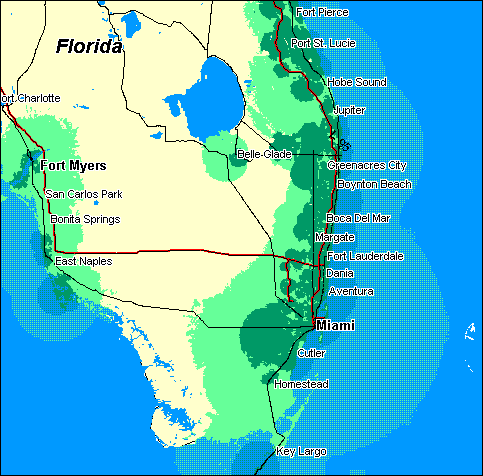
Figure 6-3: Two-way paging coverage areas.
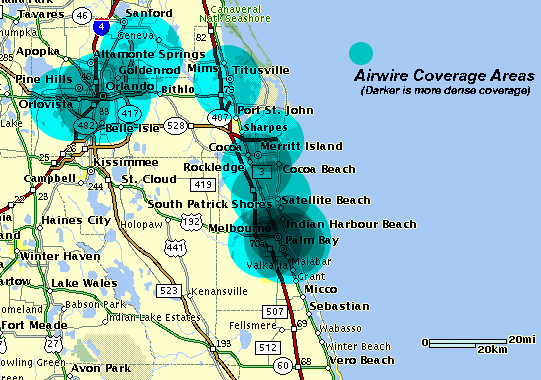
Figure 6-4: Two-way fixed wireless coverage boundaries.
Wireline DSL coverage areas are within telco exchange boundaries as Figure 6-5 shows [FPSC, 2000]. Figure 6-5 can be easily misconstrued. While the figure shows (in white) the BellSouth telephone exchanges where ADSL is supported by CO equipment, there is no guarantee that a particular subscriber located in the white area could actually receive DSL. Successful deployment of DSL depends on numerous technical factors such as loop qualification, loop conditioning, absence of bridged taps and loading coils, and distance from the CO as mentioned in 4.7.3.
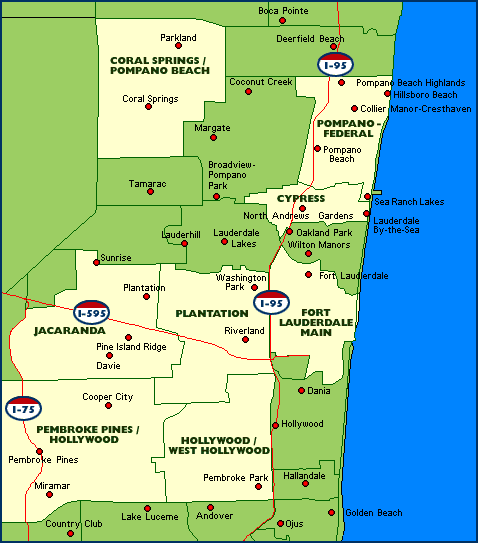
Figure 6-5: BellSouth DSL coverage areas are smaller than the exchange boundaries shown.
Figure 6-6 shows yet another kind of boundary, the service area of two-way digital cable modem and telephony service by MediaOne (now AT&T Cable) in the Jacksonville area [FPSC, 2000]. Locations shown in gray are those in which two-way cable-based access to "broadband" services are available as of March 2000. Cableco service areas are generally determined by franchise agreements made with local governments both incorporated areas and un-incorporated county administrative regions. Often, ADSL and two-way cable service rollouts attempt to compete for the same geographical market area. However, because cable service areas and telco exchange boundaries overlap (but are not geographic equivalents), market boundaries can become splintered.
Figure 6-6: Two-way cable modem serving area, AT&T Cable (Jacksonville).
Figure 6-7 (from the Desoto County Economic Development Office) shows the high-speed fiber optic infrastructure laid by Sprint in Southwest Florida. The dark line shows the location of the Sprint high-speed fiber optic conduit. Note that Arcadia, Florida happens to be one smaller community through which the fiber optic cable runs. Consequently, economic development efforts for the City of Arcadia area are able to stress the community's closeness to state-of-the art hypercommunications connections as a method of enticing business to the area. Other nearby areas such as Venice, Port Charlotte, and Sebring do not have a direct route through their communities.
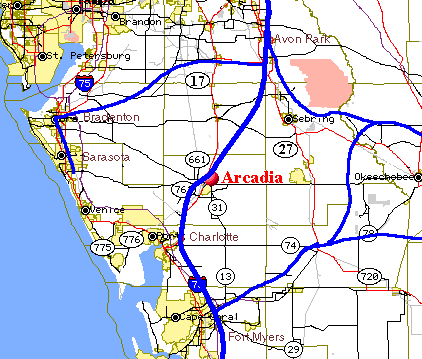
Figure 6-7: Sprint fiber optic route in Southwest Florida.
Another kind of boundary concerns the location of Tier-1 or NSP Network Access Points (NAPs) in Florida. Figure 6-8 shows the location of UUNET's (WorldCom) 45 Mbps national backbone hubs [WorldCom, 2000]. In Florida, four places (Miami, Orlando, Tampa, and Jacksonville) are shown as nodes (local hubs) on the UUNET transport level backbone. Tampa and Miami are multiple hub cities. Lines leading from Miami and Orlando offer direct service to the San Juan, Puerto Rico hubs. Atlanta, Dallas, and Houston serve as regional hubs. Indeed, as will be discussed in 7.1.4, many other providers offer major nodes for Internet access in Florida. While most are not located in rural areas, the choice of communications carrier can be important based on how closely linked to the Internet backbone that carrier is.
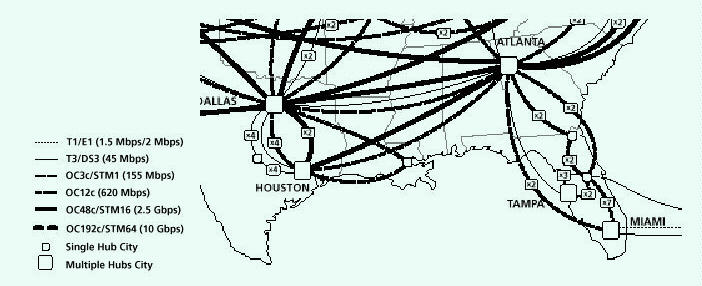
Figure 6-8: Florida's four UUNET NAPs.
Figure 6-7 and Figure 6-8 show the location of what are normally considered transport level connections, the location of which traditionally have mattered only to carriers or extremely large agribusinesses. However, fiber optic conduit is used increasingly to bypass access connections (thus eliminating access level costs) or for access to high-speed services such as SONET dedicated connections (Table 4-29). Therefore, as the proximity to NAPs or fiber optic routes grows in importance, their locations will create new technical boundaries.
Although technical boundaries can arise from geographic features, most of the technical boundaries shown in Figures 6-2 through 6-8 are based on the implementation schedules of particular carriers and on general engineering and technological progress. None are static since they can change rapidly with technological changes, new competition, and mergers. It is important to realize that each carrier offers a different coverage area so that those shown in Figures 6-2 through 6-8 are examples of individual carrier boundaries. The set of technical boundaries for all carriers over all access technologies is much larger.
6.1.2 Political and Regulatory Boundaries
The subject of boundaries would not be complete without mentioning political boundaries and boundaries resulting from a mixture of technical and regulatory reasons. Many regulatory boundaries are a direct result of the way telephone service was originally delivered and regulated. For BellSouth (and to a lesser extent other carriers) regulatory boundaries based on telephone technical boundaries from the 1930's are present today in the regulatory boundaries used for POTS (4.6), enhanced telecommunications (4.7), and private data networking (4.8).
In Chapter 5, Figure 5-5 showed the ILEC coverage areas of Florida to underscore the important role that arbitrary divisions (typically begun in the 1930s and finished in the 1970s) play in the delivery of hypercommunications. In most rural areas, the ILEC has a significant competitive advantage over other carriers based on its traditional status as a monopoly. Figure 6-9 shows the service areas of ILECs by county in the 904 area code [FPSC, 1999].
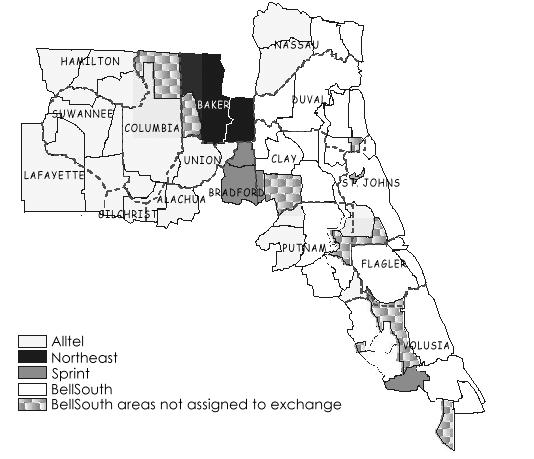
Figure 6-9: Service areas of ILECs in 904 area code.
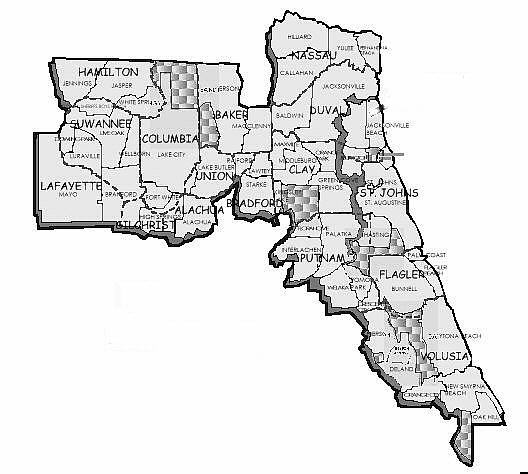
Figure 6-10: Rate centers in area code 904 cross both city and county borders.
Inside each ILEC service area in Figure 6-9 are separate telephone rate centers (used to price long-distance calls and define local calling areas) as shown in Figure 6-10 [FPSC, 1999]. It is important to note that rate center boundaries may cross both city and county lines. For example, the Branford, Florida exchange (located northwest of Gainesville) includes parts of Suwannee, Lafayette, and Gilchrist counties. In urbanized areas, rate centers may include multiple cities. For example, the Daytona Beach rate center includes incorporated areas such as Daytona Beach, Holly Hill, Daytona Beach Shores, and South Daytona as well as part of unincorporated Volusia County. Rate centers were defined by the FCC, the FPSC, and telephone companies (originating with AT&T and ending with today's ILECs). While rate centers are becoming obsolete as the transport level changes from a traditional circuit-switched PSTN orientation to a packet-switched computer network orientation, they are still widely used to price long-distance calls and point-to-point data circuits. They are also used to define local telephone service calling areas (as was shown in Figure 4-36).
Each rate center has one (or more) exchanges or wire centers that form the technical boundaries of ILECs. Each exchange has at least one NNX (telephone prefix) that is allocated among various hypercommunications needs like residential telephone service (subsidized by business telephone service), cellular, PCS, dial-up Internet access lines, fax machine lines, and one and two-way pager lines. The Jacksonville rate center (like others in urban areas) is actually a collection of exchanges shown in Figure 6-11 [FPSC, 1999]

Figure 6-11: DSL availability depends on telephone exchange boundaries.
In Figure 6-11, the exchanges shown in white have DSL available from BellSouth. By comparing Figure 6-10 to Figure 6-11, it can be seen that not every exchange in the Jacksonville rate center has DSL availability. Exchange and rate center boundaries were established for telephony, but the boundaries for DSL (an enhanced telecommunications service used both for Internet access and telephony) effectively depend on regulatory boundaries designed from telephony regulation.
Figure 6-12 shows two additional kinds of boundaries (LATAs and area codes) that affect ILECs, ALECs, and IXCs [FPSC, 2000]

Figure 6-12: Area codes and LATAs in Florida.
Florida's LATAs can be seen in Figure 6-12. They include: Pensacola, Panama City, Tallahassee, Jacksonville, Gainesville, Daytona Beach, Orlando, Tampa, Fort Myers, and the Southeast LATA (Vero Beach to Key West). Minor portions of the Savannah, Georgia and Mobile, Alabama LATAs are also within Florida borders. LATAs were designed as part of the 1984 breakup of AT&T, based on telephone exchanges and rate centers. Based on that agreement (and also according to the 1996 TCA), some carriers are allowed to carry voice, enhanced telecommunications, and data networking traffic between LATAs, while others such as Bell South are not. Firms that compete with these ILECs are permitted to carry such traffic. Furthermore, rates on many services are regulated between LATAs in a different way than traffic within LATAs. Within each LATA are a series of EAEAs (Equal Access Exchange Areas) designed to facilitate interconnection among competing carriers. Area codes (NPAs) are shaped by a combination of regulatory policy and the expected teledensity of an area.
Wireless services follow other kinds of regulatory boundaries from the FCC. Licenses for wireless communications carriers cover mobile services (such as cellular telephony, PCS, and SMR) as well as fixed services (such as MMDS, LMDS, DEMS, and WLL). Each carrier requires a license from the FCC to serve specific territories. Depending on the type of service, FCC rulings may allow one or more carriers the right to serve a specific territory. Often, auctions are used to assign licenses in new spectra to accommodate new wireless services. Figure 6-13 shows the layout of one such territorial boundary in Florida, the eighteen BTAs (Basic Trading Areas) in which licenses for MMDS, Narrowband PCS, Broadband PCS, and LMDS carriers are assigned [FCC, 00-289, 2000]
Other FCC wireless boundaries in Florida include 29 CMAs (Cellular Market Areas) used to grant cellular licenses in, 4 MTAs (Major Trading Areas) used to assign SMR licenses, and 9 BEAs (Basic Economic Areas) used to assign 220 MHz services [FCC, OET, 1999]. However, the right of a wireless carrier to operate within a particular FCC area is no guarantee that the carrier's coverage area will fill that coverage area. To do so, the carrier must construct a series of towers (along with paying the appropriate right-of-way fees to county and local governments) to inaugurate service over the widest area possible.
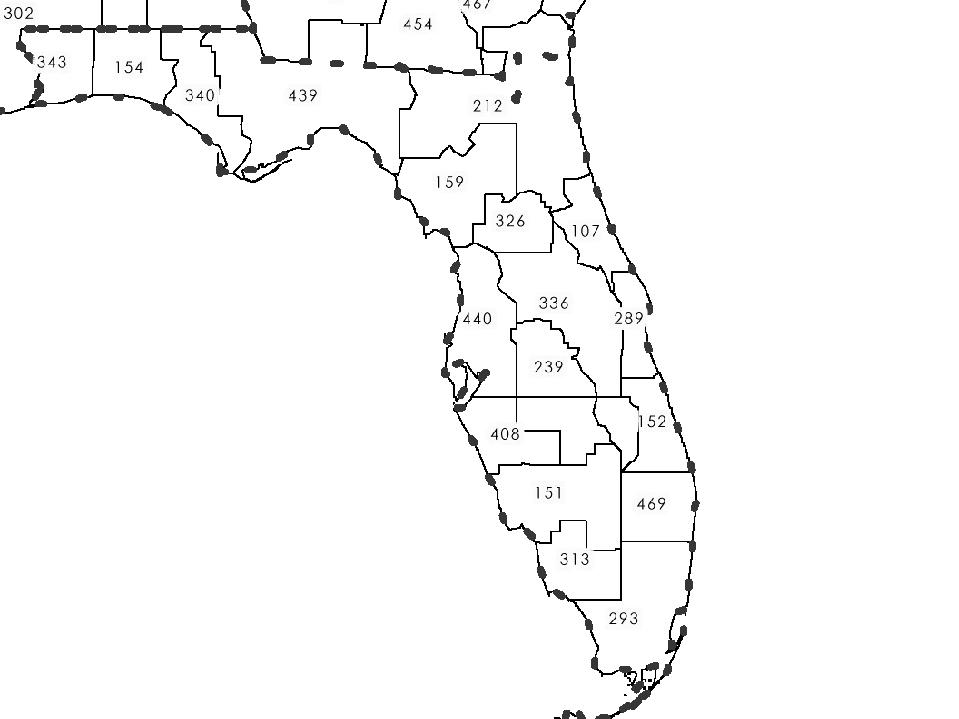
Figure 6-13: FCC BTAs define wireless licensing areas for MMDS, LMDS, and narrow and wideband PCS.
Finally, it is important to consider purely political boundaries. In Florida, there are 67 counties and 398 incorporated places. Incorporated places are city or town governments with their own police, fire, and other city services, along with several regulatory functions in hypercommunications as given in Table 5-10.
Figure 6-14 shows 28 incorporated areas in Broward County in 1997 [Broward Association of Governments, 1998]. Pure white denotes unincorporated areas. Each area is able to assess local taxes, franchise fees, and other regulatory charges as well as determine which cable television and wireless providers will earn a franchise to provide service. Many incorporated areas have annexed areas of relatively sparsely settled land on the edge of suburbia while certain poorer, longer settled areas contiguous to urban areas of Fort Lauderdale remain unincorporated. Some counties have only one or two incorporated areas, but in fast growing, urbanized areas of other counties, dozens of new jurisdictions have sprouted after 1970. One of the main effects on hypercommunications of local political boundaries is that each local jurisdiction may award a wireline cable television franchise to serve that area. Typically, the proportion of the total franchise area where high-speed access is deployed depends on the cableco's agreement with the local government.
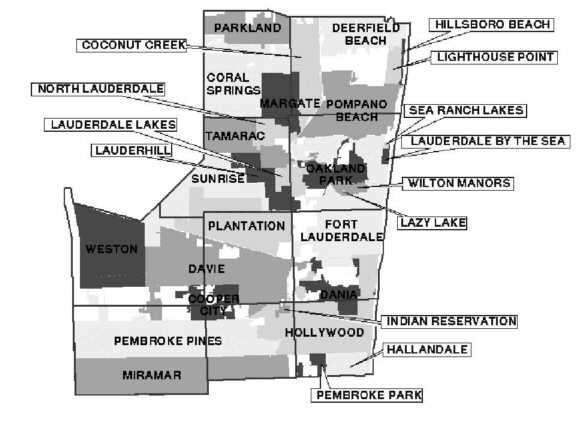
Figure 6-14: Incorporated and unincorporated areas of Broward County.
Therefore, political boundaries affect hypercommunication market boundaries in two chief ways. First, a carrier is given the right to provide access to services through the cable TV infrastructure (including telephone, Internet access, private data networking, and enhanced telephony). Second, local taxes are set based on local jurisdictions.
6.1.3 The Meaning of Market Boundaries to Two Agribusinesses
The impact of this patchwork of regulatory and technical boundaries on agribusinesses becomes apparent when the sheer number of different areas is considered. The unique hypercommunications market that a location is in is a function of how the various boundaries described overlap, along with the number of competing firms that operate within them.
Figure 6-15 explains this point graphically by considering two different agribusinesses, Online Inc. and Offline Corp. Before considering the impact on these businesses specifically, the five kinds of boundaries in the figure need explanation. The first boundary shown is the ILEC territory, shown as a horizontal dotted line near the top of the figure. In the figure, ILEC territories are divided between two ILECs: BellSouth and GTE. Next, within each ILEC's territory are several exchange (rate center) boundaries. Availability of many services and prices for others are based on the exchange boundaries. There are five such boundaries in all shown in Figure 6-15.
Third, the bold star (in three of the rate centers) is the CO for that exchange. A circular area around the star shows the distance limit for deployment of DSL (and other DSL-based products such as HDSL T-1's). Customers must be located inside of the circled area to be eligible to receive DSL. Fourth, there are boundaries of City A and Town B. These boundaries define the coverage area for the cableco. If high-speed access is offered by the cable franchise in either location, assume that it must be within the boxes shown. Fifth, the solid vertical line separates County 2 from County 1. Finally, the solid lines that run from one CO (star) to another show the location of high-speed fiber optic conduit. The location of such high-speed lines is important because high-speed network access can sometimes be bypassed for customers on such main lines but must be kept extremely short if the carrier is to build fiber to the agribusiness location.
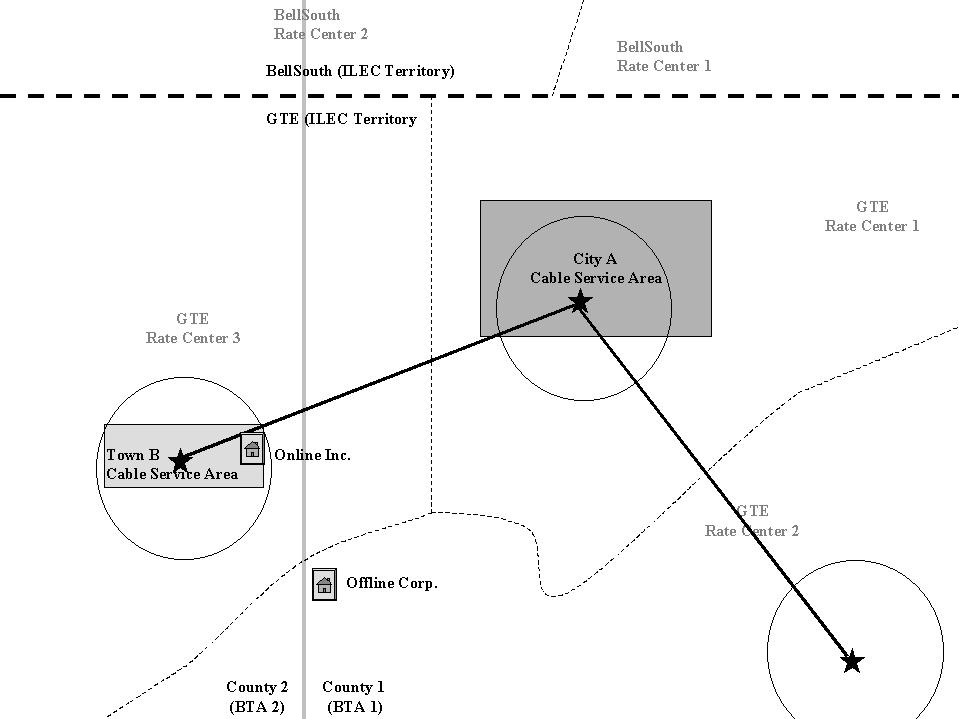
Figure 6-15: Example of how market boundaries affect agribusiness hypercommunications access.
Online Inc. will be faced with a different set of prices and choices than Offline Corp. because of the way boundaries overlap. Online Inc. may obtain DSL and HDSL T-1 services from GTE and any ALECs (and ISPs and IXCs) who serve Rate Center 3. Although Online Inc. is on the outer edges of Town B, it may also get service from the cableco. In addition, Online Inc. is close enough to the fiber optic lines that it could use "on net" high-speed fiber bypass services such as SONET or T-3 circuits if it required (and could afford) the capacity. Offline Corp., located just a few miles away, can rely only on the access network provided by GTE to its location, which is too distant from the serving CO to receive most high-speed services. Each firm is in a different BTA, a fact that could create additional competition in both cases if a wireless carrier chose to extend service to these areas. It should be apparent that Offline Corp. has a locational disadvantage where hypercommunications are concerned.
The number of different markets for hypercommunications in Florida is staggering. While not every area is independent of every other, the 461 telephone rate centers, 13 BTAs, 865 active cable TV franchise areas, and 29 CMAs make almost 1,400 different technical, regulatory, and political areas. That is without considering ISP and IXC POPs, ILEC service areas, or the influence of LATAs. Furthermore, the number of possible carriers who may decide to serve a particular location can be large or zero. For example, the 425 ALECs that serve Florida may do so in any telephone exchanges they wish where they have interconnection agreements with ILECs or IXCs [FPSC, August 9, 2000]
While ILECs are required to provide telephone service to every reasonably situated customer within their territories, they have no clear legal requirement (or in some cases permission) to offer enhanced telecommunications or broadband services. In fact, if the former local telephone monopolies concentrate their increasingly stretched resources on building rural infrastructure, they may lose even more ground to new competitors in profitable high teledensity areas. These competitors, who do not have the COLR (Carriers of Last Resort, see 5.5.3) obligations of the ILECs to provide universal service, find a market niche "skimming" off the monopolist's most profitable customers in the cities.
The hypercommunications market in Florida is a classic example of one where "markets of different sellers fit into each other in highly irregular fashion", to quote Chamberlain again [Chamberlain, 1936, p. 198]. However, regardless of market boundary, before a good or service can be priced, the units of price must be defined. Deciding on units is no easy task for hypercommunications as the next section shows.
Bundling can make understanding the units of in a hypercommunications transaction difficult or easy. Recall that bundling was one of the twelve essential terms introduced in section 1.1. While it is the last to be introduced, it is hardly the least important. Bundling arises now because the economic, technical, and regulatory foundations are out of the way. As convergence occurs, hypercommunications will be sold in bundles of composite goods rather than as separate items such as telephone calls or megabytes of data.
6.2.1 Hypercommunications Bundling
Hypercommunications services can be sold alone (un-bundled) or grouped together in a bundles of services. Bundling may be done for customer convenience, internal billing purposes, due to regulatory edict, to prevent direct price competition or otherwise confuse customers, or in an attempt to protect a supplier's incumbent (or monopolistic) position. The hypercommunications bundle is the quantity that prices are based on.
For example, a local telephone call includes many individual services. These include: the type of access loop wiring, dial-tone, switching, ringing, access level transmission, transport level transmission, busy signal, circuit establishment, connection maintenance, etc. If each component of a call was included separately on the bill for every local call, one call would result in many entries on a subscriber's monthly bill with a separate price for each one. Business telephone bills can already add up to hundreds of pages, but un-bundling every item on every local call would exponentially increase bill sizes. When a technical set of services is too complex for customers to understand in detail, bundling can help buyers understand the general nature of services without confusing them with minutiae. As with restaurant menus, ordering a la carte will still be available but more expensive. The transaction costs of placing, changing, and understanding hypercommunication orders are simply so high to buyer and seller alike that bundling can cut the costs of exchange.
However, bundling can make price comparison among competing carriers a nightmare, especially for less-informed consumers. For example, some customers may not care about (or understand) the difference between an OSP (Online Service Provider such as AOL) and an ISP (Internet Service Provider such as Mindspring). OSPs offer local POP modem dial-up (narrowband) access to a subscriber-based content and e-mail network, with Internet access available (sometimes surrounded by OSP content frames). ISPs offer narrowband and high-speed Internet access, e-mail, data networking, use of ISP servers, and other services through a combination of local POPs for access and national or international backbone peering agreements for transport.
However, it may be very difficult for customers (especially new Internet users) to compare the services between an ISP and an OSP (or to compare providers within each type) because bundling can force a comparison of apples to oranges. Most OSPs and ISPs have several plans which may include unlimited connection or access. That way, subscribers are not charged per e-mail message or by minutes of connection time. But bundles could include (or not include) web site space, 24 hour technical support, choice of billing plans, certain exclusions and limitations, access to CGI and JAVA script files, variations in e-mail features, and guaranteed or as-available connections. The difficulty is compounded when Internet, private data networking, and voice and enhanced telecommunications services may be combined as a single connection.
The FCC and FPSC have prohibited ILECs from reselling only bundled services to competing ALECs in order to foster local telephone competition. During the days of AT&T, bundling was mandatory and often veiled in mystery unless specific legal language was enacted by the states. For example, all telephone sets were leased from AT&T's subsidiary, Western Electric. Access to local and long distance lines, telephone repair and replacement, outside wiring from CO (Central Office) to curb, and inside curb, residence, and business wiring was rolled into one bundle. Operator services such as directory assistance, billing credit (for unconnected, interrupted, or noise-filled calls), emergency (police, medical, fire, call interrupt) were bundled with local service. Per minute charges were levied on only certain services such as long-distance calls.
After the breakup of AT&T, the RBOCs (Regional Bell Operating Companies such as BellSouth) began to unbundle directory assistance, operator services, and inside wire maintenance, while using bundling to sell enhanced services and special calling plans. Bundling, rather than per channel pricing, is how most "non-pay" Cable TV channels are sold as well. Technological trends in carrier hardware and software have made un-bundling easier to implement for hypercommunications customers since new services are increasingly customizable. However, unbundling tends to make billing more complicated. Service bundling is still a popular convenience for many customers, allowing hypercommunications providers to combine sets of services together for special promotions or to induce trial, thus attracting new customers.
However, the ability to bundle services differently from competitors may also be used to make comparison shopping harder and it is arguable that bills are easier to understand. For that reason, bundling strategies of hypercommunications firms are sometimes accused of being anti-competitive. Now, some suppliers such as MCI, AT&T, and Bell Atlantic-GTE are positioned as single vendor solutions for the full range of hypercommunication services. It is possible to purchase wireline or wireless Internet, wireless phone service, local phone service, computer networking, paging, e-mail, voice mail, and long distance telephone services from a single firm that also installs and sells necessary CPE. Such single vendor bundling of sub-industry services into one billed service will be the mechanism that will enable hypercommunications convergence. Some critics allege that this will guarantee less competition in the long run, because the number of firms will be reduced through mergers and acquisitions, leaving only large international firms capable of providing every service. Consequently, it is charged, the remaining firms will obtain a high degree of market power.
6.2.2 Other Hypercommunication Units
The issue of bundling provides an excellent segue into other units used in hypercommunications to construct bundles. Almost all of these have been covered elsewhere, but Table 6-1 summarizes them, shows their location in the text, and summarizes their importance to the agribusiness demander of hypercommunications. Each item may be seen as a different trading unit of hypercommunications or as an ingredient to be used in creating a service bundle.
The most frequently used term of those shown is probably bandwidth. Bandwidth (or capacity) constrains the amount of data that can be sent over a particular link in a hypercommunications link. Closely related are data rate and throughput. The data rate is the single most important factor affecting the price of a communication link. Throughput, while it is related to the speed and capacity of the communications link, also depends on the CPE owned by the agribusiness. The three pertain to all kinds of digital communications from data transmissions to telephone calls and faxes. QOS refers to multiple dimensions of hypercommunications quality and reliability. SLAs are specific guarantees of QOS levels. These concepts are explained in detail in section 4.2.
While the first six units in Table 6-1 are used to create bundles that are sold for an accounting price, the next three items may be more important to determining the economic price. The costs and benefits to an agribusiness of creating, using, and managing information within the organization are not directly priced in markets or measured on the balance sheet.
Table 6-1: Hypercommunication bundle ingredients (trading
units).
| Unit | Meaning and importance to agribusiness | Place in text |
| Bandwidth | Measure of capacity of communication connection; often what price is based on. Access and transport level capacity. | 4.2.1 |
| Data rate | Measure of speed of a communication link (DCE to DCE); price of digital connections may depend on data rate. Access and transport level speed. | 4.2.1 |
| Throughput | Measure of speed of communications (user to user), congestion and other negative network externalities show up here, as do problems with the agribusiness' CPE and local network. | 4.2.1 |
| QOS | Quality of service. | 4.2.3 |
| Bits and bytes | The bit is the smallest digital unit, a binary digit. Eight bits equal one byte. Bits are the chief units of digital communications; bytes are used to characterize the capacity of storage media. | 3.2 |
| ALEs | Access Line Equivalents. Number of simultaneous incoming or outgoing local (long-distance) telephone lines. Incoming need not equal outgoing. | 4.7 |
| SLAs | Service Level Agreements. Guarantees that particular QOS targets will be met. | 4.2.3 |
| Compressed time | Tendency for data processing speeds to move faster, causing decision periods to shorten and market conditions to change rapidly. Best prices and discounts require contractual lock-in for one to five years. | 2.5.2.5 |
| Data | Ore from which valuable business information can be created. Excess data are often unmanageable. | 2.4.2 |
| Information | Fundamental source of value in the "new economy". Can be a stock or flow, a resource or commodity, a perception of pattern, public good, uncertainty reducer, or organizational aid. | 2.4 |
| Service primitive | Techniques used to move data from one point to another. Can be connection-oriented or connection-less, reliable or unreliable, message-oriented, or byte stream. | 3.3.2.4 |
| OSI Level | Levels of network communications. Ranging from the physical level (wires and electrical energy that carries a signal) to the application level where communications occurs. | 3.3.2.6 |
The last two items, the service primitive and the OSI level, underscore that the networked hypercommunications model of communications (and not the mass or interpersonal model) is at work. The service primitive is merely a way of showing that hypercommunications takes many forms from e-mail and voice mail to interactive telephone or other real-time forms. The OSI model will help show the networking levels involved of a particular service.
However, many decision-makers have insufficient technological training to understand what their Internet options are, much less the full set of hypercommunication units. Often the firm providing hypercommunications services oversells or mismanages its capacity because of the many uncertainties involved in feedforward planning network management. Furthermore, suppliers may deliberately use nebulous units to achieve an information advantage. Therefore, it is especially important for agribusinesses to understand their unique hypercommunication needs.
Agribusinesses have a derived demand for hypercommunication services, based upon profit maximization, cost minimization, or other goals of the firm. An agribusiness manager needs to measure accounting and economic costs, benefits, risks, opportunities, and QOS uncertainties that accompany one hypercommunication choice over another. Unique communication needs for agribusinesses are where the costs, benefits, risks, and opportunities managers are interested in come from. For instance, the needs of a nursery with nine national locations (with both retail and wholesale customers) differ from those of a one-farm peanut operation or a multiple location cattle ranch.
Florida's climate, her geographic setting, her vast areas of arable land, and her people have given it a special place in American agriculture. The state has had many transitions, with agriculture contributing to the earliest ones and responding to the latest ones. This section gives a broad view of some of the unique hypercommunications needs of Florida's diverse agribusinesses. In doing so, a picture of hypercommunication's impact on agricultural input and output markets will also be painted since agribusiness hypercommunication needs depend on factors inside and outside the individual firm. Outside the firm, traditional agricultural sub-sectors and marketing channels as well as innovative new business activities of competitors influence a particular firm's needs. Additionally, the information economy combined with inexpensive global communications creates sources of new customers and new products. Inside the firm, the degrees of vertical and horizontal integration are especially important to hypercommunication needs.
Hypercommunication services are more than ordinary inputs and outputs. Information obtained by an agribusiness and exchanged within it can profoundly affect input and output markets for many goods and services, including those for agricultural products and services. Hence, the pricing and competitiveness of Florida's hypercommunication market has important effects on Florida's agribusiness input and output markets.
There are two chief ways hypercommunications improve agribusiness profits and growth. First, networked hypercommunications can cut the costs of supervision, control, and sales, while simultaneously allowing firms to operate on larger scales or wider scopes. Such results come from changes in the firm's front office (marketing and customer service) and back office (administration and manufacturing) technologies.
Second, information gathered through hypercommunications can change front or back office operations through technology spillovers. Technology spillovers occur when new knowledge is obtained directly and indirectly through hypercommunications, encouraging innovation throughout the firm. Innovation may be from product and systems development (such as a new invention or process that enables increased production while cutting costs or a new idea that frees resources allowing production of new items). Alternatively, the direct innovations may include the creation of information sales or other services. Hypercommunications can also create indirect innovation when new ideas help land, labor, capital, and management become better synchronized and more efficiently used.
This section covers five categories of interrelated agribusiness hypercommunication needs. Before covering those needs, the location and composition of Florida's agribusiness complex is summarized in 6.3.1. The developing agribusiness information economy is the first category of agribusiness hypercommunication needs, discussed in 6.3.2. Hypercommunication needs based on competitive strategies are considered in 6.3.3. Needs based on integration, channel width, and span-of-control are covered in 6.3.4. The fourth category of agribusiness hypercommunication needs (6.3.5) is based on the specific service, crop, or product sold by a particular agribusiness. Finally, needs based on an agribusiness' size or market area are covered in 6.3.6.
6.3.1 Location and Composition of Florida's Agribusiness Complex
Branson and Norvell define an agribusiness as "A firm involved in the production or distribution of agricultural commodities or agriculturally based products, or in the manufacturer and sale of farm inputs." [Branson and Norvell, 1983, p. 509] Agribusiness can be further broken into production agriculture and non-production agriculture to separate the production of raw commodities from the functions provided by the marketing chain.
The specific hypercommunication needs of agribusinesses depend on how broadly agribusiness is defined as well as where agribusiness and its trading partners are located. Communications needs depend on an agribusiness' location compared with its vendors and customers. Therefore, the hypercommunication needs of all agribusinesses (the agribusiness complex) are related to the communication needs of rural areas and production agriculture.
Based on these ideas, Figure 6-16 shows components of the agribusiness complex. In the figure, a distinction is drawn between production agribusinesses (areas C and D) and non-production agribusinesses (areas A and B). A second distinction is made between rural agribusinesses (areas B and C) and non-rural agribusinesses (areas A and D). Area E represents rural communities in general. The agribusiness complex includes areas A, B, C, and D.
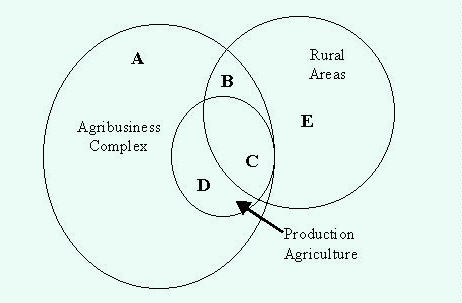
Figure 6-16: Locational and functional components of the agribusiness complex.
All three classifications have elastic definitions that affect the size of the agribusiness hypercommunications market considerably. The definition chosen for each classification alters the size of its circle in Figure 6-16. The combined definitions of production and non-production agribusiness determine the share of Florida's total economy made up by the agribusiness complex. The size of each circle can shrink or expand depending on that category's definition so that there may be differences in the relative importance of rural community infrastructures and non-production agribusinesses not shown by the scale of Figure 6-16.
The rural community circle is the first to consider. As Table 5-2 showed (in 5.2.1), the definition of rural varies, causing the rural communities circle (areas B, C, and E in Figure 6-16) to vary even more than the production agriculture definition. Its size shows both the importance of agribusiness to rural hypercommunication infrastructure development and the importance of the rural markets to agribusiness hypercommunications.
Consider the overlap between agribusiness and rural communities (areas B+C in Figure 6-16). If larger agribusinesses are the earliest adopters of high-tech hypercommunications services and technologies, then infrastructure inadequacies for an entire area might be improved as large agribusinesses demand new services first. Egan argues that business demand drives infrastructure development: "rapid development of an advanced communications infrastructure for rural America will depend on how easy it is for businesses to access the technology." [Egan 1996, p. 284] The size of the overlaps between non-production agribusiness and rural areas (area B) and production agribusiness and rural areas (area C in Figure 6-16) determines the importance of the rural hypercommunications market on agribusiness communication choices.
If hypercommunications can fade the traditional boundaries between rural and non-rural, then non-geographical spatial elements (such as market structure and technological limits) could become more important than geography. Since the information age makes the world smaller by improving access to previously inaccessible markets, agribusiness interaction with the world becomes more dependent on the geonomics of the access level infrastructure and competition in rural markets. The rural circle is also important to agribusiness communications because of the fixity of assets since an orange grove cannot be moved to take advantage of a more competitive communications market.
The next circle, production agribusiness, can be three sizes as shown in Figure 6-17. First, production agribusiness may be defined narrowly to include only farms or ranches that produce field crops, vegetables, melons, field crops, and livestock. This conservative definition restricts the definition of production agriculture to traditional farming. However, some non-traditional operations such as aquaculture and horse farms may be included within this definition of production agriculture as well. Cash receipts for producers included by the first definition totaled $5.59 billion in 1999 [Florida Agricultural Statistics Service (FASS), 1999]
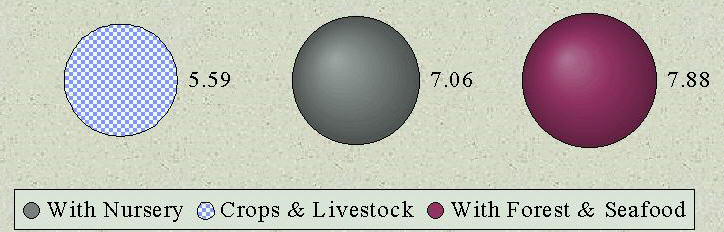
Figure 6-17: 1999 Cash receipts for three definitions of production agriculture (billions of dollars).
Second, production agribusiness may be defined to include all the products mentioned in the first definition along with foliage plants, floriculture, ornamental shrubs and trees, mushrooms, and sod. This expanded definition is important in Florida because the state produces the second most valuable greenhouse and nursery crop of all states in the nation [1997 Census of Agriculture, Ranking of States and Counties, NASS, 1999, Table 35]. The second definition also elevates the role of production agriculture in urban and suburban areas since greenhouses and nurseries are more easily fit into metropolitan areas than row fields and pastureland. Under this definition, Florida had 15,700 full-time farms with an average market value sold per operation of $172,000 in 1997 [NASS, Census of Agriculture, 2000]. Under the second definition, Florida's total cash receipts in 1999 total $7.06 billion [Florida Agricultural Statistics Service (FASS), 1999]
A third, even broader definition, includes the first two definitions, but adds farm woodland receipts and the dockside revenue gained by fishermen (landings). These producer groups increase cash receipts under this third definition to $7.88 billion in 1999 [DOACS Locator, 1997; Bureau of Seafood and Aquaculture Marketing, 1999; DOACS, Florida Agricultural Facts, 1999, p. 71]. The third definition seems appropriate when the total land in production is concerned. The 1997 Census of Agriculture reported that Florida had 10.5 million acres of farmland (some thirty percent of the state's total land area). In 1997, almost 35% of all Florida farmland was cropland, while 20% was woodland and 39% was pastureland [USDA NASS, 1997 Census of Agriculture, 2000].
All firms in production agriculture are agribusinesses. Based on the vast amount of land area in production, it might appear as though most production agriculture operations are in rural Florida (area C of Figure 6-16). Surprisingly, however, over 76% of Florida's production agriculture workers are located in metropolitan areas [USDA ERS, "Florida Fact Sheet", 2000]. In Florida, most urban and suburban production agriculture operations are nursery and greenhouse operations but a scattering of farms that are located in areas where agriculture has been largely replaced by housing are also included.
Production firms typically cannot change their locations at will. This asset fixity is important when considering the market for agribusiness hypercommunications in Florida. Figure 6-18 shows general locations of citrus, vegetable, crops, livestock, and natural agriculture (forestry and fishery) operations [USDA NASS-FASS, Florida Agriculture Facts, 1999, p. I].
However, while the map in Figure 6-18 does not suggest it, many of Florida's most productive production agribusinesses are located in counties with major metropolitan areas or have trading that is geographically concentrated in some other way. This concentration occurs not just within Florida, but within the nation and the world. The location of producers near a metro area may increase their communication options, suggesting perhaps that agribusiness is not as dependent on marginal rural infrastructures as some have suggested. However, while proximity to an urban area may mean that an agribusiness' chances for competitive access to hypercommunications are improved, it does not guarantee a competitive market as the discussion of technical, political, and regulatory boundaries in 6.1 testifies.
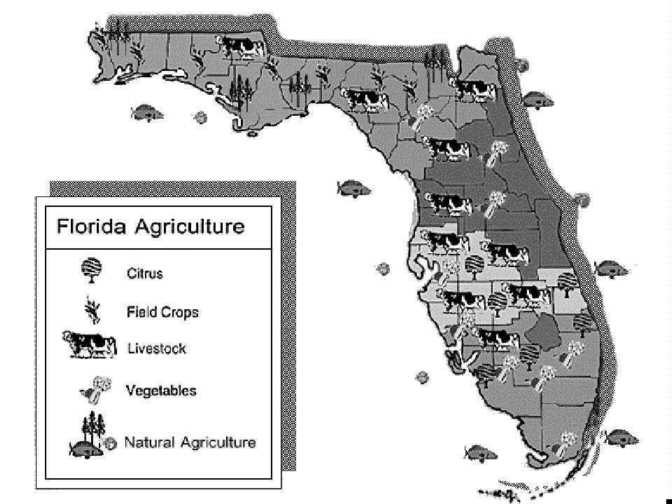
Figure 6-18: Florida agriculture specialization by region.
The concentration of producer revenue within Florida depends on the commodity as Table 6-2 and Table 6-3 show. Table 6-2 shows the market value of all agricultural crops (on the left side) and the value of nursery and greenhouse sales (on the right side). Each part of the table shows the 1997 ranking of the top Florida counties among all 3,100 counties in the United States. A few Florida counties represent large fractions of total production value as Table 6-2 shows.
Eight Florida counties are ranked among the top 100 counties nationally in the market value of agricultural products sold in 1997. Producers in these eight counties received forty nine percent of total cash receipts for the entire state. Four counties of the eight, (Dade, Palm Beach, Hillsborough, and Orange Counties) are the state's first, third, fourth, and sixth most populous counties (in that order). Florida ranked ninth nationally in the value of cash receipts.
Table 6-2: Florida counties among the top 100 ranking
counties nationally (for value of agricultural products or for value of
nursery and greenhouse crops)
| Market value of agricultural products sold, 1997 | Value of nursery and greenhouse crops, cut Christmas trees harvested, mushrooms, and sod sold, 1997 | ||||
|
|
|
|
|
|
|
| Palm Beach |
11
|
872.9
|
Dade |
2
|
242.7
|
| Dade |
39
|
416.5
|
Palm Beach |
7
|
174.6
|
| Hillsborough |
57
|
332.7
|
Orange |
8
|
172.1
|
| Hendry |
58
|
323.4
|
Lake |
15
|
118.8
|
| Collier |
77
|
276.9
|
Volusia |
17
|
111.5
|
| Polk |
85
|
253.5
|
Hillsborough |
27
|
71.6
|
| Orange |
91
|
247.8
|
Gadsden |
33
|
53.5
|
| Manatee |
97
|
239.6
|
Manatee |
41
|
45.2
|
|
Ranked counties 49%
|
2,963.3
|
Broward |
50
|
37.5
|
|
| Florida Total |
9
|
6,004.6
|
Lee |
53
|
36
|
| Collier |
54
|
36
|
|||
| Osceola |
75
|
27
|
|||
| Polk |
75
|
27
|
|||
| Highlands |
100
|
21.2
|
|||
|
Ranked counties 81%
|
1,174.7
|
||||
| Florida Total |
2
|
1,450.0
|
|||
Source: USDA NASS, 1997 Census of Agriculture, Ranking of States and Counties, Table 23 and Table 35.
On the right side of Table 6-2, fourteen Florida counties were in the top 100 counties nationally in the value of nursery and greenhouse crops, Christmas trees, mushrooms, and sod. Five (Dade, Broward, Palm Beach, Hillsborough, and Orange) of the state's six most populous counties appear among the fourteen. Only Highlands County is not part of a Metropolitan Statistical Area (MSA). Together, the fourteen counties represent eighty-one percent of total nursery and greenhouse cash receipts. Florida ranked second nationally, behind California.
In Table 6-3, production is even more concentrated among ranked counties. The table shows the value of vegetables, melons, and sweet corn (on the left side) and the market value of fruits, nuts, and berries (on the right side). Florida is ranked second nationally, behind California, in both categories.
Table 6-3 Florida counties among the top 100 ranking counties
nationally (for value of vegetables or for value of fruits)
| Market value of vegetables, melons, and sweet corn sold, 1997 | Market value of fruits, nuts, and berries, 1997 | ||||
|
|
|
|
|
|
|
| Palm Beach |
6
|
248.8
|
Polk |
17
|
175.1
|
| Collier |
10
|
169.2
|
Hendry |
18
|
165.9
|
| Dade |
13
|
129.2
|
Desoto |
19
|
143.3
|
| Manatee |
14
|
120.4
|
St. Lucie |
21
|
141.9
|
| Orange |
23
|
60.3
|
Highlands |
22
|
139.3
|
| Hendry |
25
|
57
|
Hillsborough |
24
|
135.2
|
| Hillsborough |
26
|
56
|
Hardee |
30
|
101.1
|
| Lee |
28
|
54.3
|
Indian River |
34
|
84.2
|
| Gadsden |
46
|
29
|
Martin |
39
|
69.1
|
| Martin |
54
|
20.5
|
Collier |
46
|
55.7
|
| Suwannee |
69
|
16.7
|
Manatee |
52
|
44.1
|
| Alachua |
86
|
13
|
Charlotte |
65
|
30.5
|
| St. Lucie |
98
|
11
|
Osceola |
66
|
29.8
|
|
Ranked counties 91%
|
985.4
|
Lake |
75
|
23.8
|
|
| Florida Total |
2
|
1,083.9
|
Okeechobee |
85
|
20.2
|
| Dade |
87
|
19.5
|
|||
| Lee |
89
|
18.9
|
|||
| Glades |
90
|
18.0
|
|||
| Pasco |
99
|
14.8
|
|||
|
Ranked counties 96%
|
1,432.4
|
||||
| Florida Total |
2
|
1,493.5
|
|||
Source: USDA NASS, 1997 Census of Agriculture, Ranking of States and Counties, Table 33 and Table 34.
Vegetable, melon, and sweet corn producers in the thirteen ranked counties were responsible for ninety-one percent of Florida's total cash receipts for those crops. Again, four of the state's six most populous counties are on the list. Two counties (Hendry and Suwannee) are not located in MSAs. The market value of fruits, nuts, and berries (on the right) captures mainly the influence of the citrus crop. Nineteen Florida counties are ranked in the top one hundred nationally in this category. Producers in those ranked counties make up over 96% of fruit, nut, and berry cash receipts. This category includes only two of the six most populous counties, and only Hillsborough makes a large contribution. Seven counties (Hendry, Desoto, Highlands, Hardee, Indian River, Okeechobee, and Glades) are not located in MSAs.
Tables 6-2 and 6-3 suggest four important points about hypercommunications and production agribusinesses. First, while county-level data cannot distinguish between the subtleties of urban and rural areas (as 5.2.1 mentions), county-level data can be used to suggest that many production agribusinesses are located near a metropolitan area. However, although many of the most productive agricultural parts of Florida are within the local calling area of a metropolitan area, that does not guarantee they will have high-speed hypercommunications access. Nonetheless, producers in MSAs (an especially those in the most populous counties) are in a better position than those in other parts of the state to receive high-speed wireless access. Depending on local boundaries, these MSA producers are also more likely to have several choices for wireline access now or in the near future.
Second, the ranking data suggest that production agriculture (in general) and the citrus industry (in particular) are less concentrated in MSAs. Thus, if high-speed access and competition in hypercommunications are related to county density, some sectors of production agriculture will fare worse than other sectors in the next few years. A third point concerns the difference between revenues and the number of operations. Tables 6-2 and 6-3 use rankings based on revenues, not farm numbers. Rankings based on countywide revenues do not tell anything about the total number of operations.
Fourth, the tables suggest possible differences in access among producers of a particular crop based on location. A nursery in Broward County probably has (and will continue to have) better access and more hypercommunications choices than will a Gadsden County or Highlands County nursery. To the extent that hypercommunications give producers a business advantage, that advantage may come only to producers who are located in advantageous locations to begin with. It is important to note that advantageous locations may be based on factors such as transportation routes and distance to market that are positively correlated with hypercommunications advantage.
The rural circle and the production agriculture circle shown in Figure 6-18 have now been covered. The analysis above suggests that the rural circle may represent a somewhat smaller part of production agribusiness than would be expected in other states. However, many agribusinesses cannot be classified as production agriculture. The third circle, non-production agribusinesses, makes up four basic areas: farm input suppliers, processors and marketing firms, wholesale, and retail operations.
Again, there is a question of how broad the definition should be. According to Florida's DOACS, the agribusiness complex contributes $20 billion in direct farm-related economic impact on the state and $55 billion in direct and indirect value added from the farm gate to the supermarket [DOACS, Florida Agricultural Facts, 1999, p. 1]. Forest and forest products contribute an additional $8 billion to the state's economy, while the seafood industry adds $1.4 billion to the economy [Jacobsen and Vericker, 1998; Bureau of Seafood and Aquaculture Marketing, 1998]. Thus (as shown in Figure 6-19), depending on the definition of the production that underlies their efforts, non-production agribusinesses add between $33 billion and $84.4 billion to Florida's gross state product. With Florida's gross state product estimated at $400 billion, the agribusiness complex contributes from eight to twenty-one percent of that amount.
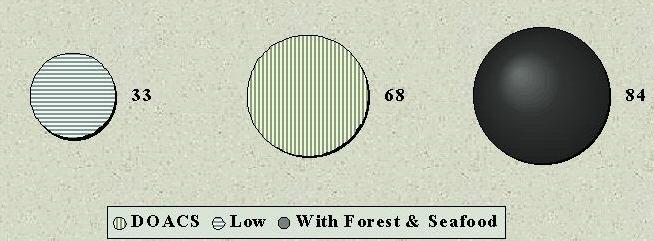 Figure 6-19:
Three estimates of the total economic impact of Florida non-production
agribusinesses (billions of dollars).
Figure 6-19:
Three estimates of the total economic impact of Florida non-production
agribusinesses (billions of dollars).
Most non-production agribusiness employment is in non-rural areas. According to the ERS and other agencies, 14.2 percent of total metro area employment was in farm and farm-related jobs while 22.1 percent of total non-metro employment was in farm and farm related jobs in Florida during 1996. When extrapolated onto 1998 total employment, this translates into over 1,100,000 employees of metro agribusinesses and almost 99,000 employees of non-metro agribusinesses in 1998 [USDA ERS, Florida Fact Sheet, 2000]. When employment in forest products and the seafood industry are added in, the total climbs to the 1,479,722 employees as shown in Figure 6-20 [Jacobsen and Vericker, 1998; DOACS, Florida Agricultural Facts, 1999, p. 75; DOACS, "State of Florida Facts", 2000].
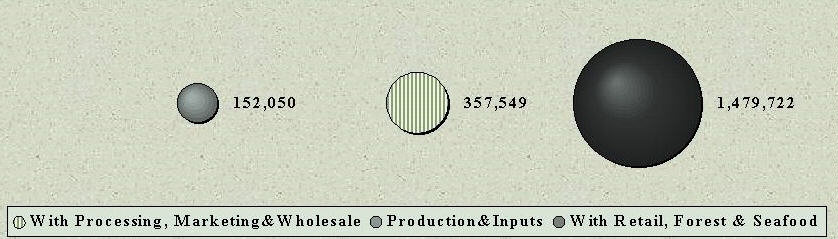
Figure 6-20: Total employment of Florida's agribusiness complex varies by definition.
The broadest definition of an agribusiness in Figures 6-19 and 6-20 would include the communication needs of retail outlets as wide ranging as grocery stores, restaurants, and furniture showrooms. However, the narrowest definition might exclude important parts of the agribusiness complex that are responsible for adding the most value to food and fiber producers output. Clearly, the more people employed by the agribusiness complex, the greater the need for hypercommunications and the greater the size of the agribusiness hypercommunications market.
However, there is no definitive answer to the size of the agribusiness complex. The relative sizes of production compared to non-production and the overall size of the agribusiness complex give different pictures of the extent of the hypercommunications market. Many hypercommunication needs do not depend on the size of the agribusiness hypercommunications market but on the unique characteristics of agriculture and specific characteristics of individual firms. Before considering some of the more specific needs based on competitiveness, vertical-horizontal integration, agribusiness type, or size of agribusiness, the next sub-section considers the needs of the agribusiness sector as a whole.
6.3.2 Unique Characteristics of Agriculture and Agribusiness Hypercommunication Needs
It is often said that agriculture is a unique industry. While that is true, in many ways, the discussion in Chapter 2 of the three foundations of the information economy (communication, technology, and information) applies to agribusiness just as it does to other industries. Some have argued that extractive industries such as agriculture and mining are somehow not part of the new "weightless" economy [Rawlins, 1992]. In spite of those arguments, many agree that over the past decade agriculture has evolved into "an information-intensive food production system" [Saxowsky and Duncan, 1998, p.5].
Taylor and Fairchild explain how IT will transform agribusinesses:
Given the importance of the information economy to agribusiness and the importance of hypercommunications access and transport to information acquisition, many unique characteristics of agriculture create specific hypercommunication needs. Table 6-4 lists eighteen unique characteristics of agriculture, describes each one and related agribusiness hypercommunication needs.
Not every item in Table 6-4 is unique to agriculture. Other industries have instability, asset fixity, and environmental concerns, and share many of the economic characteristics mentioned with agriculture. The true uniqueness of agriculture (and the source of many unique agribusiness communication needs comes) from the fact that the combination of characteristics in Table 6-4 and interaction among them are specific to agriculture alone.
The first unique characteristic to agriculture is the uncertainty biology brings to production. Tweeten describes this as the "unpredictable and uncontrollable influence of weather, insects and other pests, diseases" and the resulting impact they place on producers and non-production agribusinesses alike [Tweeten, 1989, p.20]. Having better information can prevent or reduce risks, while improve timing and efficiency. Hypercommunication is especially important because it provides the pipeline information flows over to reach farms and ranches that require an increasing amount for precision agriculture or other high-tech information-based production needs.
Table 6-4: Unique characteristics of agriculture result
in agribusiness hypercommunication needs.
| Characteristic | Description | Hypercommunication needs |
| 1. Biological production uncertainty | Unpredictable, uncontrollable influence of weather, insects, and diseases. | Many. More information can prevent or reduce risk. |
| 2. Inelastic SR price elasticity of demand | Food maintains life. Food security is important to national security. | Disaster recovery, food aid, international markets. |
| 3. Inelastic SR price elasticity of supply | Once crops or trees are planted or animals are bought, suppliers cannot adjust to price changes. | Many. Real-time information allows better producer reaction. |
| 4. Low income elasticities of demand | Consumer budget share for food is low, falls as income rises. | Many. Better service, niche and direct marketing, customization. |
| 5. Producers may face highly price elastic demand | Producers have no market power. They depend on volatile spot, forward, futures, and options markets. | Many. Real-time information helps tailor strategy to price. |
| 6. Dependency on global markets | Exports are important due to foreign competition and worldwide commodity markets. | Low communications costs reduce international barriers. |
| 7. Fixity of assets | Tractors, land, agricultural equipment may be little use for anything other than specific crops. | Few. Assets for sale may be more liquid. |
| 8. Legislative and public relations | Governments target policies to agriculture; importance of family farm, image of agriculture | Some. Agriculture's story is both cheaper and harder to get across. |
| 9. Environmental concerns | Farming practices influence the natural environment, many are under attack. | Many. Improved industry practices, better education. |
| 10. Food safety and health | Legal and ethical burden to provide safe and healthful food throughout distribution chain. Food is the source of human nutrition; importance of organic products | Many such as problem response and prevention, interactive education. |
| 11. Bio-technology | World food crisis created need to improve productivity, nutrition, and safety. Opponents cry "frankenfoods". | As in #10, but add the transgenic firm, new legal rules. |
| 12. Seasonality of demand, supply | Importance of timing in marketing chain at producer, wholesale, and retail levels. | Information can match demand seasonality with supply seasonality. |
| 13. Storability, perishability | Certain products spoil quickly, require storage or special shipping and handling. | Tracking, automated ordering, shipping. |
| 14. Importance of cooperative action | Producers are too small to vertically integrate unless they cooperate. Little incentive exists outside of group action to advertise and market commodities. | Varies based on whether management is centralized or vested in members. |
| 15. Farm and other labor | Shortages, controversy over illegal immigrants and housing. SOHO, mobility, cybercommuting. | Important to full-time or mobile sales workers. |
| 16. Land and land tenure | Social, economic issues regarding farm tenancy, urban encroachment. | Role of infrastructure location on returns. |
| 17. Influence on rural areas | Some areas are economically dependent on farming. | Varies by location. |
| 18. Cycles and instability | Animal, orchard, commodity cycles, and instability of returns increase risk, lower speed of adjustment. | Information about risk and instability. |
Source: some characteristics are based on Tweeten, 1989, pp. 1-31.
Biological uncertainty brings specialized hypercommunication needs to non-production agribusiness also. Having better information about weather and other uncertainties faced by producers that can create potential supply shocks helps marketing firms plan evasive action. Such evasive actions include increasing stocks, increasing storage capacity, searching for alternative suppliers, and changing recipes or formulas. Information about competitors' actions and technology transfers also helps non-production agribusinesses weather supply shocks due to biological uncertainty, even helping with invention of new products and processes that improve an entire operation or product line.
A second unique characteristic is the inelastic short-run price elasticity of demand of food at the industry level and for many individual agricultural products. The main reason for the short-run demand price inelasticity is that food products are essential to human and animal life [Tweeten, 1989]. In emergency conditions such as hurricanes or other disasters, restoring communications to agribusiness to ensure a steady food supply can prevent famine and public unrest. For this reason Florida disaster preparedness instructions for communications restoration rank non-production agribusinesses (retailers, wholesalers, and middlemen) behind only law enforcement and health care as an essential service. Larger agribusinesses and retail operations need to have robust, redundant communication systems because of the importance of food to society.
Food security is important to national security. Thus, international agribusinesses, food aid, and food policy require effective and efficient transportation and communications infrastructures. IT and hypercommunications can allow cheaper and more effective timely international communications than ever before. However, foreign infrastructure and the protection of national PTT (Post, Telephone, and Telegraph) monopolies can hamper the ability of agribusiness and NGOs to communicate cheaply.
Another unique characteristic of agriculture is price inelastic short-run supply. Once crops or trees are planted or breeding stock is purchased, suppliers cannot adjust quickly to changes in price. For example, once a field crop has been planted and starts to grow biological processes take over, and farmers cannot change short-run supply response to price as well as producers in many other industries can. The impact hypercommunications can play in mitigating negative effects of this characteristic is major. For example, localized real-time information about planting intentions could allow producers to form more informed expectations, possibly helping to reduce the chronic oversupply that plagues U.S. agriculture.
A fourth unique characteristic of most agricultural products is that income elasticities of demand are low [Tweeten, 1989]. As incomes rise, much of the increase is spent on goods and services not related to the agribusiness sector. Therefore, growth in demand for food products must come from overseas markets or from population growth rather from better economic conditions.
However, new methods of marketing and positioning agricultural goods and services can counteract this. Direct marketing techniques, agri-tourism, eco-tourism, recreational tourism, and niche product positioning can be used to keep some production agribusinesses in farming by diversifying operations and improving bottom lines [USDA AMS, 2000]. These techniques require a high dependence on hypercommunications especially because such agribusinesses must have the ability and capacity to handle more communication directly with consumers than they are accustomed to. Non-production agribusinesses may have to vertically integrate (and even establish retail arms) as IT alters the supply chain. Better communications are at the heart of both strategies. In both cases, better customer service, customized products, and real-time information are needed to appeal to and serve high-income customer demand. Such a strategy can help counteract both low income elasticities of demand and the next characteristic, price taking.
A fifth characteristic of agriculture is that individual producers face an extremely price elastic demand. Producers have little market power so they are dependent on prices that are set in spot, futures, forward, and options markets. By altering the marketing strategies of the agribusiness (by offering custom services and personalized products aimed at high-income groups as described above), a producer may become a monopolistic competitor with somewhat more control over price. Additionally, even for commodity producers and marketing firms that depend on open market pricing, better information can help the timing of buying, selling, storage, and other decisions to lessen the effect of price instability. The Internet has created a revolutionary increase in the availability of real-time information about markets and prices along with new markets. Transaction costs have plummeted, while the amount of available information has grown faster than the costs of access and transport have fallen. However, it can be hard to evaluate the quality of large quantities of information.
On a related note, agriculture's next unique characteristic is its "high dependency on precarious foreign markets" [Tweeten, 1989, p. 21]. The DOACS reports that for U.S. fiscal 1997-98, almost $1.1 billion dollars worth (16.3% of cash receipts) of production-level crops were exported from Florida. In addition to new foreign markets for citrus juices, increased competition with Mexico in tomatoes, squash, snap beans, cucumbers, bell peppers, and other vegetables shows Florida producers and processors that the domestic market is really a world market. However, Florida's strategic position near Latin American growing markets and the promise of improved trade with the Caribbean and Africa should see its rank climb from the 17th leading U.S. agriculture export state. Not to be ignored is the importance of foreign markets as a source of production inputs and ingredients for non-production agribusinesses.
Several hypercommunication needs stem from the importance of global markets on agribusiness. Most importantly, lower costs of communications with overseas (especially via the Internet) allow even small agribusinesses to seek new buyers or vendors anywhere in the world. While the importance of global markets varies by crop, hypercommunications also allow agribusinesses to be well informed about international markets, import and export regulations, and gives them closer contact with foreign agents or salespeople. While inexpensive hypercommunications increases international communications, this is one area where middlemen (such as export brokers and importers) could see their roles grow due to the red tape involved in international trade.
The seventh unique characteristic discussed in Table 6-4 is fixity of assets. Much of the capital equipment used in agriculture may be specific to agriculture only or even to a specific crop or animal. While many agribusinesses are leaving agriculture or moving operations as urbanization swallows up vast tracts of arable land in Florida, some land is so remote or otherwise unsuitable for development that it too must remain in farming or become idle.
While hypercommunications does not alter the physical reality of asset fixity or reverse urbanization, two communication needs relate to this characteristic. First, assets that have to be sold may be more liquid since the Internet can increase the seller's audience size substantially, broadening the extent of the market. Second, to the extent that an improved hypercommunications infrastructure can help agribusinesses increase returns on land, it is possible that more land will stay in agriculture instead of being converted to urban uses.
Another unique characteristic of agriculture is the importance of lobbying, government relations, and public relations. Many federal and state policies are specially targeted to agriculture so that both production and non-production agribusinesses have special communication needs based on their membership in a common political network with similar interests. The importance of the family farm to U.S. farm policy is one example of a message that goes across commodity lines. In many other cases, segments of agriculture work at cross-purposes. Agriculture's story is cheaper to get across over the Internet due to low per unit costs of web pages and legislative alert e-mails. However, agriculture's story is also harder to get across through the clutter of increased message traffic.
Producer associations, trade groups, and farm organizations are using the Internet (along with Internet site design and promotion suggestions such as those given in 4.9.3 through 4.9.5) to defend, explain, and educate the public about Florida agriculture. Organizing letter campaigns or other efforts among members of a human network connected by a common communications network with a choice of message types (like the Internet) is cheap, effective, and simple.
The ninth unique characteristic is agriculture's effect on the natural environment. While other industries affect the environment, production agribusiness is unique because it occupies more land area than any other industry. Farming practices such as agrochemical use, monocropping, soil conservation, wetlands reclamation, land use, water use, and others influence the overall natural environment. In Florida, many of these practices are under attack, such as the controversy regarding the alleged contamination of the Everglades by sugar operations and dairies. Just as with the public relations-government characteristic just mentioned, hypercommunications (especially the Internet) allows agriculture to get its message out quickly and cheaply. It is easier than ever for agribusinesses to explain their positions and educate the public through group or individual action. The Internet creates new venues of debate and opens (through e-mail and other technologies) new methods of communication. Also important is environmental education of farmers themselves, made cheaper for extension and other interest groups.
Another unique characteristic of agriculture is the importance of food safety and healthfulness. In reality, this characteristic covers several areas. First, agribusinesses have a legal and ethical responsibility to provide safe food products throughout the distribution chain. Second, since food is how human nutrition is satisfied, information about the nutritional content, best ways to prepare, and information about disease fighting properties of food are important to the public and news media alike. A third area important to non-production agribusinesses especially is the burgeoning nutraceutical market.
These areas give birth to several hypercommunications needs. First, the ability for an agribusiness to communicate the details of a food recall swiftly and accurately to retailers or other distributors is important. Since communication is a two-way process, handlers or other manufacturers must be able to answer questions about a recall or food safety scare from other agribusinesses, the news media, and the public in as uniform and accurate a manner possible. Interactive web sites, e-mail response teams, emergency communications policies, real-time inventory location networks, and telephone hotlines are some examples of specific tactics that might be necessary. Now, such techniques do not require a large staff or a big budget to implement.
In addition to the prevention of and response to safety emergencies, consumers are increasingly concerned with the quality of the food they eat. This concern can include nutritional labeling, fat content, country of origin, humane animal production, organic production, preservative and additive content, and the disease-fighting or health risks of particular foods or additives. Therefore, in addition to providing food, agribusinesses provide information about food. Indeed, such information may be more than general information or recipes; it may have to accompany product through the distribution chain. This task may eventually require an extranet for data and inter-channel voice communications among (and within) each level of the marketing chain.
Non-production (and some production) agribusinesses need to be equipped to handle questions from the public ranging from recipes to nutritional information. Customers may require assurance that organic foods really are organic beyond simple labeling. Information about general handling and the specific history of a particular purchased item are especially important to kosher, organic, and humane-animal production shoppers. Increases in customer interest could result in communications volume that may require an increase in communications capacity and staff. Internet and call center technologies provide inexpensive methods to handle such needs provided the advice given in Chapter 4 is followed.
Another issue has recently gained greater importance to form the eleventh unique characteristic of agriculture. This is the issue of biotechnology or the use of genetically modified or biologically altered foods within the food chain. The world food crisis created the need to improve agricultural productivity, increase nutrition per unit, and improve food safety. One way agricultural scientists have responded has been by genetically altering crops and animals to make them grow larger faster while using fewer resources. However, these moves have created changes in distribution chains (the so-called transgenic firm, Baarda, 1999) as well as cries of "frankenfood" from certain groups who claim that genetically altered foods are both unethical and dangerous.
Again, the communication needs created by biotechnology tend to be based on tracking information about a particular batch or lot from the farm gate to table. Biotechnology increases the importance of such information to agribusinesses because biotech foods are patented and cannot be bred, copied, or otherwise handled outside of vertical and horizontal rights without risking legal penalties. Thus, in addition to public relations communication needs and the need to track and label biotech foods to satisfy consumer concerns, agribusinesses must carefully track movement of these products to avoid lawsuits. The need to track food and information about specific lots, batches, and shipments of food as it moves through the distribution process is simplified considerably by using private data networking. That means an Intranet or VPN within a firm, an Extranet or web-based VPN among firms, and a strategy for communicating directly with wholesale and retail buyers that may include call center technology, e-mail, and a web page.
A twelfth unique characteristic of agriculture is the seasonality of demand and supply. Specific hypercommunication needs are necessary because of the importance of market timing at the wholesale, producer, handler, and retail levels. Seasonality is important to producers because the time of planting and harvest are chosen to fetch the best return. For non-production firms, the task of equating demand seasonality with the seasonality of supply is a difficult one.
An example should clarify the difference between demand seasonality and the seasonality of supply. Ice cream exhibits demand seasonality based on how hot temperatures are. Cows produce milk throughout the year, so there is no significant seasonality of supply. Snap beans are harvested in Florida from January through March while Florida strawberries are in season from February 1 to the end of April. Both strawberries and snap beans produced in Florida exhibit seasonality of supply. It is far easier for dairy producers to produce ice cream according to changes in demand related to the weather than it is for strawberry or snap bean producers to change production seasons or space production evenly through the year.
Handlers and other marketing firms must decide whether it is more profitable to store production and release it over time at a constant level or to market crops as they are harvested. For some crops such as fresh snap beans and fresh strawberries, the agribusiness complex aims at specific market windows. For example, Florida produces 100% of the domestic snap bean supply during the January-March window.
Some of the communication needs resulting from seasonality relate to many that have already been covered. Seasonality makes it clear that communication needs vary by level of distribution and by crop. Since there are a variety of marketing strategies, there are a variety of communication needs. Generally, it can be argued that better and more timely information helps agribusinesses execute strategies better. This is especially true when hypercommunications allows more information to be gathered faster and cheaper than using standard telecommunications. The Internet and other forms of hypercommunications are especially helpful to retailers who are regularly looking for sources of fruits and vegetables.
The next set of unique characteristics handling, storability, and perishability are related to seasonality. The fact that many kinds of foods (including vegetables, meats, and fruits, and dairy products) require special handling such as refrigeration or packaging is also closely related to food safety and healthfulness. In addition, it is often desirable to store products over time to plan for seasonal changes in retail demand or to ensure that they are available to agribusinesses that use raw or processed ingredients to produce finished foods. Perishability crops (such as certain vegetables and fruits) spoil quickly so the time it takes them to travel from farm to table must be kept as short as possible. Since Florida produces the second most valuable vegetable crop in the country, handling, storability, and perishability are important issues.
Several communication needs result from storability, handling, and perishability. The most obvious is the importance of logistics. Improvements in logistics (the timing, scheduling, and delivering of goods) have come from information technology and from hypercommunication technologies. Through a combination of Intranets, GIS positioning transmitters in trucks, and other inexpensive wireless tracking systems such as the Ardis network, it is possible to pinpoint the location of any shipment with great precision. A value-added service that can be offered is the ability of customers to track their orders using the agribusiness logistics system (often furnished by the merchandise carrier) via a web site or extranet. Information technology and hypercommunications accurately track handling and storage as well. Retailers are able to move produce (and other goods) from distribution centers to stores as needed, using real-time, automated systems that use private data networks and powerful inventory applications to automate ordering and shipping. However, such systems are only as good as the people who run them and are too costly at present for smaller firms to afford.
The fourteenth unique characteristic of agriculture (the importance of co-operative action) stems directly from the fifth characteristic (no market power for individual producers). Since individual producers have no market power, there is an incentive for group action to vertically integrate, lobby, and establish and fund advertising and marketing programs. Since co-ops are member owned and operated, they may require particularly good hypercommunications. The kind of communications needed depends on whether the co-op has a strong centralized management or operates with strong member control and choice [Branson and Norvell, 1983, pp. 258-265].
Co-ops may require inexpensive communication links from handling or processing locations to producer-owners. In addition to using e-mail extensively to inform members, co-ops offer subscription web-based access to account and other co-op information for members. Many commodity advertising and promotional efforts require web-based marketing as well, so that individual producers may obtain some of the benefits of being on the Internet without each getting a separate website.
A fifteenth characteristic where agriculture is unique compared with other industries is the farm labor market. It is widely known that there are two farm labor markets, the market for full-time production workers, and the market for part-time, seasonal workers to help with the harvest. The nature of harvesting crops is such that many production workers are part-time. The shortage of farm workers and controversy over illegal immigration and worker housing conditions combine to create a labor market that is unstable and sometimes an embarrassment to the agricultural sector.
While many industries find that the Internet helps them find employees from all over the country, the part time farm labor market is probably an exception since most migrant workers lack information technology skills and network access. However, better communications helps labor contractors search for workers cheaply over a wide area. IT and hypercommunications are important for firms such as Florida Agricultural Services who can take care of all hiring, paperwork, and wages for production workers.
The market for full-time employees in production and non-production agribusiness is increasingly using the Internet for successful nationwide recruiting. As with the rest of the economy, agribusiness communication networks must be flexible enough to handle cybercommuting and SOHO users. As was mentioned in Chapter 4, Internet and Intranet VPN solutions along with the ability to place and receive telephone calls at home offices as though in the office are growing more important. New technologies make these options affordable even for smaller firms. The ability to communicate while mobile can be important to busy producers, agribusiness sales staff, and other personnel. Figure 4-29 in 4.4 showed the enormous variety of mobility and data rates available for second and third generation wireless services.
Land and land tenure issues are another unique characteristic of agriculture. There are many social and economic issues related to farm tenancy and urban encroachment on production agriculture. The communications impact here is uncertain also, but there are a few issues related to hypercommunications that arise. One issue (already mentioned under asset fixity) concerns the extent to which land becomes more valuable and more productive based upon its proximity to high-speed hypercommunications infrastructure or its location inside hypercommunications market boundaries (6.1). For farmers who are seeking additional land or who wish to find tenants, the Internet is becoming increasingly important. While real estate is not sold over the web, detailed descriptions and illustrations of property help principals and agents alike to select parcels worthy of further consideration.
The seventeenth unique characteristic of agriculture, the influence of the agribusiness economy on rural areas, has already been discussed. In Florida, some small communities (and even entire counties) are classified as agriculture-dependent. That means that the farm economy and non-production agribusinesses (together with economic multipliers) may represent the bulk of the economy in a particular area. Chapter 5 regarding rural hypercommunications policy (along with specific infrastructure and service material in Chapter 4) discuss problems of rural areas in detail.
The last unique characteristic of agriculture concerns cycles and instability. While already encompassed by other characteristics, the cycles and instability inherent in agriculture bear separate mention because they highlight several hypercommunication needs. Animal, orchard, crop and commodity life cycles are a part of agriculture that were well known before computers were invented or the Internet was created. One communications need is the need for practical information from purposeful communication. Hypercommunications can help agribusinesses reduce risk by serving as the direct, real-time link to the trading floor where risk is transferred. Information gained through hypercommunications and then crunched by computer can help agribusinesses tell how important commodity cycles are to their business. Some of the instability present in agriculture can be smoothed simply with better information. Better communications and information may reveal that some agricultural cycles may be in the mind of the technical analyst rather than in the reality of the market.
Another communication need is to ask, instead of how to do my job right, what is the right job to do?, as Peter Drucker does. For example, it can be easy when thinking about the time compression that information technology has ushered in to forget that citrus trees are classified as unbearing "by popular custom" for the first four years after they are planted [Jackson, 1991, p. 137]. It is easy to think that regardless of how quickly the grower can communicate with the outside world, the orchard cycle creates a four-year lag in how quickly he can adjust to market signals.
But instead of deciding to run a citrus operation in indifference to the information age, many growers understand the edge that hypercommunications can give them in spite of seemingly unbendable natural laws. Communication with the outside world, perhaps while "wasting time and being inefficient" is "the way to discovery" according to Kevin Kelly [Kelly, 1997, p. 14]. As technological changes occur, information technology will probably continue to change at a faster rate than citrus tree biotechnology will. Nonetheless, production and non-production agricultural technologies are changing also, sped along by hypercommunications, education, and research. One example given in Chapter 2 is the recent AP story "Biotech pigs grow 40 percent faster, larger." [Associated Press, December 7 and December 8, 1999] Thus, for growers who seek innovative new technologies (or invent them), there can be substantial payoffs from trying to shorten supposedly fixed planting cycles.
In fact, both hypercommunications supply and agribusiness demand for hypercommunications depend heavily on technical intelligence and the management of innovation. An important part of managing any business in the information economy is the technical intelligence function. According to Ashton and Klavans, "most firms do not have formal technical intelligence programs; they expect intelligence information to emerge as a routine part of all or some staff members' jobs. On the other hand, a growing number of firms have implemented some form of deliberate technical intelligence effort in their organization." [Ashton and Klavans, 1995, p. 3] One way technical intelligence and innovation management affect agribusinesses is through hypercommunication needs based on the need to become (or remain) competitive.
6.3.3 Hypercommunication Needs Based on Competitive Strategy
Hypercommunication needs based on the need to be competitive are strategic. An agribusiness may conclude that its hypercommunication needs consist of matching what a certain competitor is already doing. Another agribusiness may decide that it has a need for a new strategy because it concludes that it will go out of business if it does not upgrade from separate legacy networks to a converged hypercommunication network. Finally, a third agribusiness may decide to lead the competition by using hypercommunications to innovate by being the first firm in the world, country, state, or county to use a particular technology or service to reach employees, customers, or vendors. In each case, the agribusiness perceives that it can increase profits, improve market share, raise revenue, or simply ensure its survival by adopting hypercommunications as part of a competitive strategy.
Some hypercommunications needs based on competitive strategies are unique to agribusiness while others are not. That is because hypercommunications, technology, and information (a trio of positively correlated factors) change an industry from the outside and from the inside. Importantly, if history is any judge, the dramatic changes occurring in agriculture due to all three factors will wipe out some operations, create others, and make still others much larger and more efficient. Competitive pressure due to new hypercommunication services and technologies such as the Internet, e-business, CTI, VPNs, and other high-tech changes in business networking are present in agribusiness as in other industries. However, technological developments within agriculture are responsible for hypercommunication needs based on the need to compete in areas such as precision agriculture, biotechnology, and agribusiness intelligence.
Technological changes from within Florida agriculture in the past have led to changes in the structure and number of agribusinesses. Internal technological changes included refrigeration for produce to reduce spoilage, new fertilizers adapted to sandy or clay soils, new pesticides adapted to indigenous pests and humid conditions, and new herbicides adapted to indigenous and non-native weeds. While the new internal technological change saved some agribusinesses and allowed others to be established, smaller producers (who could not afford the technology) and others (who were late to adopt) went out of business.
Similarly, technological changes from outside agriculture have led to restructuring of Florida's entire agribusiness complex. External technologies such as better transportation and air conditioning tended to change land uses to urban and bring tourism-related industries to Florida, displacing many agricultural operations. However, while these external technologies caused Florida's population to swell, new agribusinesses were established to serve the larger population, while still others moved operations to less urbanized areas. However, many smaller producers were forced out of business by external technological change as well.
Technological change brought by the information economy to Florida agribusinesses is both an internal and an external change. Just as successful urban businesses have thrived on intelligence and R&D gained through hypercommunications, so too have successful agribusinesses benefited. However, many production-oriented farms, ranches, and nurseries may be efficient producers but are inefficient at processing and receiving information. As time passes in the hypercommunications adoption process, the chance increases that some agribusinesses will become the latest casualties of technological change.
However, smallness is not an excuse to fail with hypercommunications (as it may have been with past technological changes) since benefits of hypercommunications adoption are not as restricted to large firms. As the real price of transport and access continue to fall, small operations can communicate with the outside world the way Fortune 500 firms did a few years ago. Late adopters of hypercommunications and information technology could lose out to early-adopting competitors who have had time to benefit from a growing volume of real-time information about prices, weather, and other unique characteristics of agriculture as given in Table 6-4. Competitive disparities between evenly suited competitors can develop almost overnight because of a combination of hypercommunication boundaries, regulation, and management inertia.
Additionally, the ability to communicate in volume over great distances at costs a fraction of what they were even a few years ago suggests that the amount of data reaching many agribusinesses is increasing exponentially. For information inefficient agribusinesses, increased information flows can be a disadvantage. If an information inefficient firm collects far more information than an information efficient competitor but gets lost in its superior volume, it may go out of business although it possesses the key to future profitability. Time compression may speed up this cycle.
Therefore, the unique role of information and hypercommunications as inputs, outputs, and sources of innovation mean converged networks are an increasingly important competitive tool. However, the CPE an agribusiness buys is limited not only by its budget, but also by the local infrastructure and the level of competition among carriers within the boundaries of local hypercommunication markets where it has offices. Florida has built a communications and transportation infrastructure that has ended the twentieth century nicely. Unfortunately, the twenty-first century may see some Florida agribusinesses lose out to competitors in states with more widespread high-speed network access and higher capacity transportation facilities and communications infrastructure. Other Florida agribusinesses could lose out to competitors inside the state that have better infrastructures or more competition in hypercommunications access and transport.
Hypercommunications convergence (4.1 provides several dimensions) has profound implications on defensive and offensive competitive strategies for all Florida businesses including agribusinesses. Hypercommunication needs based on competitive strategies come from four general sources:
2) How local infrastructures are developing unequally.
3) How different services and technologies will be sold to Florida agribusinesses, together with QOS and carrier differences.
4) How doing business in agriculture is likely to change
with convergence.
The second source of hypercommunication needs based on competitive strategies, how local infrastructures are developing unequally, also was covered in detail in previous sections. Several kinds of infrastructure have been given already including the telephone infrastructure (4.3.2), the cable TV and fiber infrastructure (4.3.3), and the wireless infrastructure in 4.4. In all, ten infrastructures capable of delivering high-speed access were given in Table 5-4 in 5.2.2, but most parts of Florida are served by at most one of these. Additionally, hypercommunication boundaries (discussed in 6.1) create localized infrastructure differences so that agribusinesses as close as one mile from each other can have great variation in service availability.
While unequal infrastructure development is often considered a temporary problem, there can be no doubt that it can affect the ability to use hypercommunications to compete. Infrastructure inequality does not affect only rural areas; suburban and urban areas have great variation in infrastructures, access, and competition. Infrastructure differences can force businesses to tailor their competitive strategies for using hypercommunication according to their location. In that way, infrastructure inequality can alter competition.
The third source of competitive strategies comes from how different services and technologies will be sold to Florida agribusiness, together with QOS and carrier differences. Eventually, one transport network and one access connection will replace separate access connections to separate networks for telephony, enhanced telecommunications, private data networking, and the Internet. To be competitive and remain that way, agribusinesses will have to understand hypercommunications services and technologies and learn to determine the amount they need in their business. Thus, one hypercommunications need is to understand what services are being purchased, what hypercommunication technologies are capable of, and what QOS is. Competitive strategies based on ignorance of hypercommunication services, technologies, and costs can lead to becoming less competitive.
Chapter 4 provides a detailed treatment of services and technologies to acquaint agribusinesses with information about specific services from traditional telephony (4.6) to Internet (4.9). Dimensions of QOS are discussed in 4.2.4, with Table 4-3 covering fifteen dimensions of QOS. The competitiveness of an agribusiness depends on reliability and other QOS characteristics of its hypercommunication choices. Differences among carriers are covered in Chapter 7. The more an agribusiness understands hypercommunications, the better it can negotiate with carriers to fulfill its need to compete.
The final source of competitive hypercommunication strategies, how doing business in agriculture is likely to change with convergence, must be viewed through customer and employee eyes in addition to a purely strategic view. Based on a careful assessment of how customers and employees will react to and learn to use new communication technologies, hypercommunications can be used as a competitive weapon. However, agribusinesses must be careful to form reasonable expectations about how quickly and to what extent changes will occur.
One example of how doing business in agriculture may change due to hypercommunications is by the gradual replacement of traditional customer interaction with the Internet-based e-business model (4.9.9). There is competitive pressure for some agribusinesses to become e-agribusinesses, sometimes without considering downside risks and organizational competencies inherent in such an approach. One of the most important questions is whether the agribusiness can handle the volume of communications and information from becoming an e-agribusiness, especially whether the firm has personnel who are capable and willing to do so.
For example, the Internet is an information gathering tool and a communications network with low recurring transport costs along with extremely low variable access and transport costs. However, there are fixed costs to program and establish an e-commerce site along with capital cost for the CPE (computers, telephones, fax capability, web servers, and security firewalls). There are also new risks from dealing with the unknown. System errors can be extremely costly, time-consuming, and can mysteriously re-occur although technical staff or vendors assure customers that they have been fixed. Plans for contingencies and redundancies must be made because as hypercommunications increase in importance, so does the cost of downtime. Hence, as the section on Internet services and access (4.9) argued, becoming an e-business will consume more resources than the standard business model in the short run and create new risks.
Furthermore, using hypercommunications as part of a competitive strategy requires that agribusinesses not become so enamored with hypercommunications that they forget the desires and abilities of existing customers. True, hypercommunications can save on transaction costs compared to traditional stores or traveling personal salespeople by establishing call centers and user-friendly interactive websites with interactive, responsive technical support. Indeed, the accounting and economic costs of answering an inquiry via e-mail are small compared with costs for personal sales calls, overnight courier packets, or even USPS postage. It can be tempting to expect that long-distance telephone calls and faxes will give way to e-mail overnight. However, the transition from hypocommunications to hypercommunications is often a slow process that will never be complete because not all customers wish to (or are able to) communicate in the same way. There is a risk of losing customers entirely or seeing the average sale per customer plummet if the transition is too rapid, too impersonal, or if there is not a trained, information literate staff. Customer service cannot be sacrificed in the name of the efficiency of high technology without repercussions on sales and profits.
The term pioneer advantage is often used to suggest that a competitive advantage accrues to the first innovator, but there is a vigorous debate about whether pioneers actually have advantages [Goldner and Tellis, 1993]. Indeed, some argue that with many high technologies, there is a long record of pioneer disadvantage. In many cases, the earliest adopters failed and their mistakes were exploited by an "early middle" who carefully observed what went wrong and, with the benefit of another firm's hindsight, avoided the missteps taken by the pioneers. To Stone the belief that technology alone can turn a bad business model around is an example of a phenomenon Friederich Hayek called 'synoptic delusion' [Stone, 1997, p.9].
It is important to keep a cautionary eye open to competitive disadvantages that can occur from using hypercommunications as a competitive tool. As the agricultural marketing chain develops into a specialized network to take advantage of positive network effects, it is important to realize that network effects can be negative as well. The next three sub-sections consider the interaction between hypercommunication needs and how doing business in agriculture will change due to information technology and networked hypercommunications.
6.3.4 Needs Based on Vertical and Horizontal Coordination and Integration
Hypercommunication needs depend on vertical and horizontal coordination and integration in the agribusiness complex. Table 6-4 (and the discussion in 6.3.2 regarding the uniqueness of agriculture) mentioned some examples of specific hypercommunication needs based on an agribusiness' position in the distribution chain. This sub-section expands on the previous discussion by considering hypercommunication needs that stem from networks of vertical and horizontal integration and coordination in agribusiness. Additionally, some argue that new diagonal networks (necessitated by the growing importance of information and hypercommunications) are causing the two-dimensional agricultural marketing chain to evolve into an innovative, multi-dimensional mega network [National Council for Agricultural Research, 1998].
Thus, the hypercommunication needs of an agribusiness depend on two important marketing chain factors: dimensions and span-of-control. There are three dimensions to the agribusiness marketing complex: vertical, horizontal, and diagonal. Span-of-control may be either coordinated or integrated. Before covering general and specific hypercommunication needs based on the dimension and span-of-control of a particular agribusiness, it is important to establish the meaning of each factor.
On the vertical dimension, vertical integration occurs when one firm "controls the flow of a commodity across two or more stages of food production." [ERS, AIB-720, June 1996, p. 1] Vertical market coordination entails "clear and distinct price signals transmitted by the marketing system among the stages and particularly to producers and to buyers" [Branson and Norvell, 1983, p. 100]. Vertical market coordination also includes orderly and efficient movement of products from one level (or stage) of the marketing chain to another. The difference between vertical market coordination and a vertically integrated firm is that a single firm accomplishes integration while markets and other institutional networks of many different firms are needed for coordination.
Vertical coordination between the producer level and higher levels in the marketing chain may be accomplished in two ways. The traditional method, open production, occurs when a firm buys commodities from producers for a market price determined at the time of purchase. Open production makes information about real-time prices and price discovery especially important to producers and non-production agribusinesses alike. Contract production, a second form of coordination, occurs when a firm contracts to buy commodities from a producer according to a price agreed upon when the contract is signed before the purchase is actually made.
There are two types of contracts between producers and commodity buyers. One type is the production contract (where the contract stipulates a specified quantity and quality to be sold by the farm, but the contractor and not the producer owns the crop, pays for inputs, and makes most production decisions). A second kind of producer contract is the marketing contract, where a negotiated price (or range of prices) is agreed upon along with a specific quantity or quantity range. However, the marketing contracted producer owns the crop, pays for inputs, and makes production decisions. While only 11 percent of farms had either type of contract in 1993, contracting operators accounted for 40 percent of farm product sales; though some 27 percent of sales from contract farms were sold outside of contract [ERS, "A Close-up of Changes in Farm Organization", 2000]. Production contracts are especially common for poultry operations while marketing contracts are more common in cash grains, vegetables, fruits, and dairy operations.
On the horizontal dimension, integration and coordination relate to how a single level of the marketing chain is organized. Horizontal integration implies that one firm controls the activities of many other firms, locations, or products in the same line of business, at the same level of the marketing chain. Horizontal coordination occurs when firms at a particular level of the marketing chain participate in markets, cooperatives, and other institutions in order to allocate resources and to move products efficiently.
The diagonal dimension arises when agribusiness firms and firms in other industries exploit positive network effects to create new, interdisciplinary markets [Hinterhunber and Levin, 1994]. Typically, the diagonal dimension is expressed through a strategic partnership where diagonal coordination occurs between firms in different industries. However, diagonal integration can occur when one firm controls its strategic partner in another industry. A strategic partnership between a grocery retailer and an e-commerce software and networking services company in a joint venture of an online grocery store would be an example of diagonal coordination.
The levels or stages of the marketing chain make up the vertical dimension. Branson and Norvell identify nine stages of agricultural marketing and two supplementary marketing services that comprise the vertical marketing chain. These are given in Table 6-5 where each stage is identified along with examples and the marketing functions of each stage. Integration and coordination in agribusiness are complicated by the fact that the marketing stages and functions can vary among specific commodities. For example, the citrus, dairy, and vegetable industries have differences in the functions accounted for by vertical levels. Therefore, Table 6-5 is a general representation of stages.
Hypercommunications and better information are responsible for a general trend called channel collapse where some intermediate levels of the marketing chain (often called middlemen) become obsolete or unnecessary due to information technology and inexpensive and improved communications. As raw commodities become increasingly tailored to processing (so that discriminating customers may obtain specific characteristics), direct communication between processors and producers or between processors and consumers is increasingly important [ERS, AIB-720, June 1996]. Assemblers and wholesalers who only profit from wide, generic product lines are endangered by channel collapse especially since middlemen can actually interfere with the satisfaction of consumer wants because they represent an additional level of communication.
Channel collapse occurs with search goods. Search goods are goods that consumers (or firms at other stages in the marketing chain) are willing to spend time searching for information on. Often, search goods have been equated with big-ticket purchases where the cost of searching is worthwhile. Two trends enlarge the number of search goods in agriculture. First, food safety, and concern over organic foods, biotechnology, and humane animal production increase the amount of information searching customers find worthwhile. Second, the cost of information seeking is falling while the ability to automate the search process rises. Hence, individual consumers may be willing to seek new retailers and new channel members may take advantage of the demand by bypassing tradition-bound channel structures in favor of new arrangements now made possible by improved communications.
Table 6-5: Stages in the agricultural marketing chain
| Stage | Examples | Functions |
| 1. Assembly of raw commodities | Commodity buyers, grain elevators, packing houses, cotton gins | Brings raw commodities produced by many firms into uniform lots. |
| 2. Transportation | Trucking carriers, airfreight of perishables, water and rail transport. | Move products between stages to right place at right time. |
| 3. Storage and warehousing | Refrigerated warehouses, atmosphere controlled warehouses, heated warehouses, freezer warehouses. | Move product through time, match seasonality of supply to demand seasonality, |
| 4. Grading and classification | Normally part of storage or assembler, grades, and standards set by trade or USDA. | Find value of a lot for end users. Ensure quality standards. |
| 5. Processing | Fruit and vegetable canning and freezing plants, meat packing plants | Convert raw commodities into salable form for consumers or processing. |
| 6. Further processing, manufacturing, product development | Food manufacturing plants | Create finished, ready-to-eat, or other convenience goods. |
| 7. Packaging | Makers of boxes, plastic wrap and bottles, and other containers for food products. | Protect product; provide convenience for shippers, retailers, and consumers. |
| 8. Distribution (wholesaling) | Independent wholesalers who market products to retail distributors, retail distribution centers, exporters. | Selling, organizing transporting, and financing shipments to retailers, HRI. |
| 9. Retailing | Food stores, HRI | Sell or prepare finished goods for final consumers. |
| Supplemental marketing services | ||
| Futures, options, and forward markets | Futures contracts, options on futures, forward contracts traded on organized exchanges. | Transfer of price risk between hedgers and speculators |
| Credit and banking | Banks, farm lenders. | Short-term to long-term credit on products, equipment, and land. |
| Insurance | Crop insurance, flood insurance, custom insurance | Transfer of other risks. |
| Hypercommunication networks | Web sites, e-commerce sites, virtual networks, price bots. | Provide information, communication, and markets. |
Source: Adapted from Branson and Norvell, 1983, p. 59.
However, before getting into specifics, each vertical stage in Table 6-5 has general hypercommunication needs as well. Figure 6-21 shows four quadrants that are based on the horizontal-vertical distinction and span-of-control. However, the position of an agribusiness in a quadrant does not mean its needs are identical to others in that quadrant since other factors influence hypercommunication needs. In Figure 6-21, horizontal needs are based on integration; for example, whether the agribusiness has one or many locations in which it does business. The term location includes more than physical offices or farms; it also involves salespeople on the road, production personnel scattered over a single site, SOHO workers, and cybercommuters.
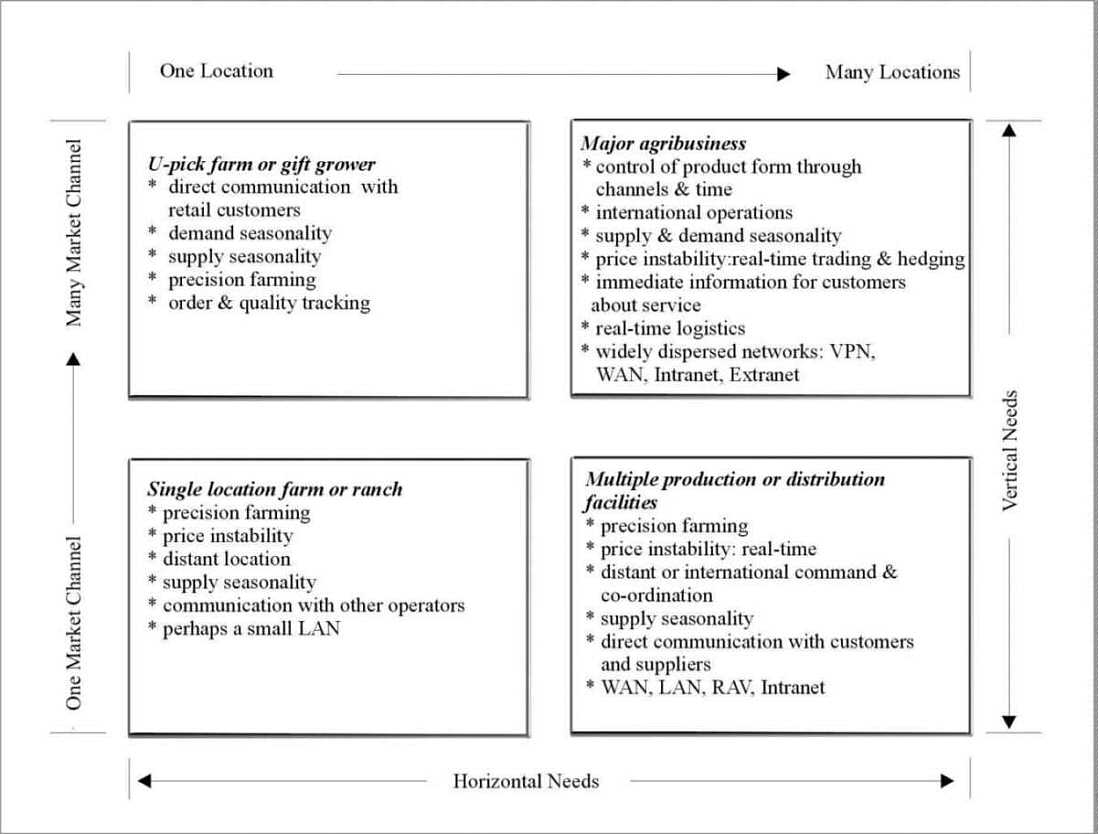
Figure 6-21: Vertical and horizontal agribusiness communication needs.
The upper right quadrant in Figure 6-21 represents agribusinesses that are both vertically and horizontally integrated. While such firms are usually large multinational corporations, hypercommunication needs based on such an integrated form depend on more than just the size and geographical distance of communications. Better communications allow the integrated firm to monitor and control operations better. Even large firms cannot get rid of supply and demand seasonality. However, if the horizontally and vertically integrated operation has an intelligence gathering and analysis capability, it may be better prepared to work around instability. Price risk may be countered through better information along with real-time trading and hedging, requiring Internet connections with high reliability along with an understanding of the strengths and limitations of the online broker to be used.
Another hypercommunication need is to provide customers real-time customer service information as well as having such information available for internal movement of goods inside the firm. Data communications are important for interfirm communications, while outside customers may rely on voice communications more. External and internal communications may occur more efficiently, with greater choice of message type, and lower costs through CTI (computer and telephone integration). The discussions in Chapter 4 about voice-data consolidation (4.5.4), call centers (4.7.2), and VPNs and converged networks (4.9.7) are especially aimed at horizontally and vertically integrated firms. Superior integration requires real-time logistics possibly with QOS SLAs (guarantees) from hypercommunication carriers because downtime becomes especially expensive if the firm's strength is in its integration. Due to the importance of internal communications that are also secure, WANs, Intranets, and VPNs are likely to be used by agribusinesses in this quadrant. Distributed client-server networks (3.5.5) and inter-networks or Intranets (3.5.6) are likely to be the most successful network design by firms in this quadrant.
The lower right quadrant in Figure 6-21 shows agribusinesses with few channels but many locations, the classic case of horizontal integration. Examples of such firms can be found at all levels of the marketing chain, including transportation carriers and wholesalers, retailers, and other firms with multiple production or distribution facilities. At the producer level, single farming or livestock operations who operate dozens of large farms scattered over the United States and the world are a prime example. Horizontally integrated firms need secure, reliable, and inexpensive data and voice communications to connect their locations. Additionally, they must communicate with vendors and customers in other vertical levels of the agricultural marketing chain and outside of it.
Needs vary according to the marketing level and the specific product produced and handled. However, such horizontally integrated operations may operate at scales where they can afford sophisticated precision farming and multiple-location logistical systems. While multiple locations may diversify price risk, large operations still face price instability and need real-time information about prices, supplies, and demand. If the horizontally integrated firm is not a retail or wholesale operation, it may be especially concerned with seasonality of supply. Multiple location farms can use hypercommunications for yield monitoring, harvest staffing, scheduling, and monitoring, and for precision agriculture and remote sensing applications. An organization with such a large footprint may have a difficult time coordinating communications with marketing levels above and below it, something an Extranet could help with. Extranets are becoming particularly important in shipping and transportation, as well as for agribusinesses that sell to retail chains. The firm might benefit from having an Intranet to maintain privacy of horizontal communications as part of a WAN. LANs may be important at individual locations, though for some horizontally integrated agribusinesses, Remote Access Vehicles (RAVs) are important since employees may be so dispersed that each one is in a different location.
The upper left quadrant of Figure 6-21 shows agribusinesses with few locations but many channels. This quadrant represents what might be called single-location vertically integrated firms. Examples might include gift fruit growers and shippers and U-pick operations or other producers who engage in direct marketing. Producers who create side businesses (such as bed and breakfasts, guest ranches, or other agri-tourism such as hunting and fishing packages) are included here as well. Hypercommunications for these firms require direct communication with retail customers. Such operations are subject to demand seasonality and seasonality of supply but must manage seasonality themselves.
Direct marketing by farmers is seen as an excellent opportunity for producers to remain in farming by using channel collapse to their advantage [USDA AMS, 2000]. However, for producers who start U-pick or tourism operations, establish gift or home cooking businesses, or plan to market commodities directly to wholesalers or retailers, information and communications become more important. Retail customers may require order tracking, quality control, and may need plenty of information and ask frequent questions. Government regulations and permits, changes in insurance, and the need to learn new skills lead to the requirement for new kinds of information, something the Internet can deliver inexpensively.
Such firms may need a LAN, but are likely to require hypercommunications for external communication since they do not have extensive horizontal communication needs. The telephone and the Internet are especially important for establishing relationships with customers, learning about what similar operations are doing, as well as directly taking orders from consumers and tracing them if needed. For very small operations, at least a website, an e-mail address that is checked frequently, a fax machine, a credit card POS approval terminal, and some extra telephone lines (possibly with voice mail) are likely to be important.
One advantage of hypercommunications technologies and services is that they can be labor savers for small businesses as well as larger ones. A website can take orders and answer a large volume of customer questions through FAQs on websites or by auto-response e-mails. E-mails and voice mails can be sent and received 24 hours a day at the convenience of customers and the agribusiness. Businesses with as few as six employees can service hundreds of customers a week, provided they have the communications capacity to deal with sudden day-to-day spurts of orders and "normal" seasonality accompanied by frequent dry spells. Firms can hire fulfillment services to take orders and ship them instead of trying to plan employment and communication capacity around instability.
For single location, vertically integrated producers with retail tourism or commodity sales or for those with wholesale-retail activity, enhanced telecommunication services and technologies (described in 4.7) become cost effective once the number of analog telephone lines reaches eight or ten. If their website is hosted by a hosting company (see 4.9.3) and Internet, fax, and voice traffic are combined onto a unified high-speed, variable-capacity connection, then small companies can reap multiple benefits. They can communicate in greater volume, with a larger choice of message types, over longer distances, and at less cost than they can with multiple telephone lines. However, a considerable investment by the agribusiness in CPE may be needed.
The lower left quadrant in Figure 6-21 shows agribusinesses with a single location at a single stage of the marketing chain. Many family farms and small production operations fit in this area. With the exception of nurseries and greenhouses, operations in this category are the most likely to be dependent on the vagaries of rural infrastructures and variances in availability due to hypercommunication boundaries. Single location farms and ranches need to communicate with vendors and customers, but they also benefit by communicating with each other.
Hypercommunication needs are closely allied with information needs. Klair, Boggia, and Richardson argue that farmers in the information age have several information needs. These include farm management, risk management, government programs and extension services, quality production, technical information about cultural practices such as organic farming, pest management BMPs (Best Management Practices), marketing and advertising management, and new technology evaluation and introduction [Klair, Boggia, and Richardson, 1998]. CNN Interactive reported that the farming industry was being "rocked by the Internet" with specialized web auctions of a variety of farm products and web sites that allow farmers to buy inputs ranging from cattle embryos to used farm equipment [Frauenfelder, 1999].
However, while Internet access and computer ownership are advertised as being vitally importance to individual producers, as recently as July 1999 a majority of farms in Florida were without a computer. According to USDA NASS, 45 percent of Florida farms had computer access in 1999, up from 41 percent in 1997. In Florida 39 percent of farms own or lease a computer in 1999, while 27 percent of those use computers for farm business. The number of farms with Internet access jumped from 19 percent in 1997 to 34 percent in 1999.
If the farming industry is being rocked by the Internet and farmers have so many information age needs, one might expect to see higher computer and Internet penetration. Not surprisingly, one reason for the apparent paradox is that farm size matters. The NASS data showed larger farms were more likely to own computers, to use them in farm business, and to have Internet access. In 1999, 64 percent of farms in Florida with over $100,000 in sales had access to computers, 56 percent of farms owned or leased computers and 40 percent used computers for farm business. Among Florida farms with over $100,000 in sales, 42 percent had Internet access in July 1999, compared with 21 percent in July 1997 [USDA NASS, "Farm Computer Usage and Ownership", 1999]. It is possible that operators of smaller operations are too busy, subject to poor rural infrastructures, or lack the skills or assets needed to buy computers and Internet access. It is important to realize that while there are scales of operation for some hypercommunication services, hypercommunications can be packaged so that small farming becomes more viable.
Many studies have sought to learn more farm penetration of computers and the Internet along with more about the kinds of farmers that adopt new technology and their information needs [Baker, 1989; Peña, 1999; Gwin and Lionberger, 1993; Daberkow and McBride, 1997; Jones and Mishoe, 1982, IFAS, 1982; Lionberger and Gwin, 1982, Webb, 1982; Ferguson and Israel, 1999; Wu, et al., 1999; Hoag, Ascough, and Fraiser, 1999]. Another reason often cited for relatively low computer and Internet penetration on farms is age. The average age of U.S. farm operators is increasing, reaching 54.3 years in 1997, up from 53.3 years in 1992 and 50.5 years in 1982 [NASS, 1997 Census of Agriculture, 1999]. Both computer penetration and Internet use fall as age rises. Indeed, the situation may not be very different than it was for other cases of technological change. Larger farms with younger owners more willing to take risks adopt new technology early, then end up buying the operations of their more reluctant neighbors who end up not being able to fight the technology treadmill [Tweeten, 1989].
Regardless of the rural sociology of adoption behavior, agribusinesses in the lower left quadrant of Figure 6-21 have unique hypercommunication needs based on vertical communication with buyers and vendors and horizontal relationships with other producers. Internal communication needs might require a small LAN and some mobile communications to keep the operator in touch with his office as he works. However, many of the seven new needs for information (identified by Klair, Boggia, and Richardson in 1998) can be or are being met by the Internet.
Farm management is one area where computers have been used for years. Mainly the computer has been used for BackOffice duties such as accounting, payroll, and similar chores using spreadsheets or similar all-purpose software. Now, highly specialized packages such as CitrusPro software (www.citruspro.com) are available in separate modules for tracking harvesting and yields, managing groves, and for citrus processors.
However, farmers use the Internet along with remote sensing hardware to tell them when (and precisely where) chores such as irrigation and fertilization need to be done. Precision farming techniques such as these can be enabled by aerial mapping data and computer mechanization of farm hardware to identify problems and opportunities farmers and ranchers might otherwise miss. Precision farming and computer mechanization are new technologies designed to help farmers with their needs for farm management information and quality production information, (as well as being capable of actually doing work). One reason farmers have a third information need (for new technology introduction and evaluation) is because of developments in this area.
Hypercommunication needs include better information about price discovery and instability, along with supply seasonality. The Internet is already helping with the need for risk management information. However, using the Internet can require considerable information literacy. The Internet offers online futures trading for hedgers and numerous free sites with information about weather, prices, international competition, etc. Information about weather risks is more available. Farmers can be awakened by weather radios if a freeze warning is declared at midnight or alerted to impending severe weather such as tornadoes and hail. Such information can be transmitted free to pagers, wireless telephones, fax machines, or e-mail addresses automatically through the National Weather Service's EMWIN system.
Subscription services such as AgCast and FarmDayta's AgDayta service are designed to help busy farmers find exactly the information they need from the Internet but lack the time to search. Farmers no longer need to leave the farm since they can use e-commerce and auction sites to purchase equipment, feed, and other inputs, and even get farm loans online from farmcredit.com, the website of farm Credit Services. Not all farm supply firms plan to create B2B websites to sell directly, because it is thought that online sales are not tailored to local conditions and cannot provide the information and personal relationships that sales representatives and dealers can. However, most suppliers do offer farmers the ability to get detailed information about highly technical products such as chemicals, equipment, fertilizer, and seeds online as well as offer product support by e-mail, special websites for customers, and other information.
Needs for information about government programs, Extension programs, cultural practice information, and new technologies are also available from free web sites such as the very general www.agriculture.com and the very specific www.beekeeping.org. Farmers benefit from being able to meet other producers all over the world and communicating with them directly in chat rooms, USENET news groups, bulletin boards, and other online networking settings. Of course, a single operation may benefit from hypercommunications in other ways as detailed throughout this section and Chapter 4.
Another way of analyzing the unique hypercommunication needs of agribusinesses based on vertical and horizontal co-ordination and integration is by using empirical data. Multiplier data are perhaps the best available data. While such data have drawbacks, they can be useful in roughly quantifying the importance of hypercommunications within broadly defined segments of agribusiness. National Department of Commerce BEA (Bureau of Economic Analysis) multiplier data for 1996 serve as proxies for the importance of hypercommunications in Florida in 2000. While these data are for broadly-defined segments of agribusiness, are at the national level, and are old as far as new hypercommunication technologies are concerned, they provide an idea of communications share of budget data for different firms.
Data for calendar 1996 on the relative importance of communications has been prepared by the BEA (Bureau of Economic Analysis) as part of annual Input-Output multiplier data [Okubo, Lawson, and Planting, 2000]. Multipliers associated with three industry categories communications (excluding broadcasting), computer and office equipment, and data processing services can be combined to arrive at an idea of the importance of hypercommunications in general. The importance of data communications alone is illustrated by the second two categories, while the communications multiplier alone is a proxy for the importance of voice communications. Multipliers can be used to examine the importance of hypercommunications both as a production input and as a factor contributing to total revenue. Therefore, the importance of communication down the marketing chain can be compared with the importance of communication up the marketing chain.
Table 6-6 shows rankings of direct requirement coefficients based on their combined share of intermediate inputs. These values show the amount of communications (alone or combined with the two computer categories) required to produce one dollar of industry output for different levels of the distribution chain. The combined share of inputs column shows the share of purchased inputs of the row industry accounted for by a combination of communications, computer and office equipment, and computer and data processing services, a proxy for hypercommunications. The communications-only column shows the share of purchased inputs represented by communications alone, a proxy for voice communications. The ratio of the combined share to the communications-only share is one way to express the importance of data communications versus voice communications. The higher the data ratio in the last column, the higher the need for converged networks might be expected to be, unless all data equipment is used solely on premises.
Both columns are crude ways of showing the direct requirement of hypercommunications from the row industry down the marketing chain. For example, the share of purchased hypercommunication inputs for air transportation is 6.2%, while for communications alone the share is 2.1%, a ratio of 2.95:1, suggesting that data communications are more important to production than voice. For livestock and livestock products, the share of purchased hypercommunication inputs is 0.288%, while for communications alone the total is 0.283%, a ratio of 1.01:1, suggesting that data communications have little importance in production. Not surprisingly, the share of the air transportation industry's costs accounted for by communications is considerably higher than that for livestock products.
Table 6-6: Share of production inputs represented by hypercommunications
for various segments of agribusiness
Source: [Okubo, Lawson, and Planting, 2000, Table 3, Commodity-by-industry direct requirements, pp. 66-72]
The top of Table 6-6 is dominated by transportation and wholesaling functions as evidenced by the stage codes based on Table 6-5. In the first levels shown, over 5% of inputs are hypercommunication related. Hypercommunications are especially important to freight forwarders, wholesale trade, and air transportation. The middle of the table is dominated by services and manufacturing levels. The bottom portion of the table is dominated by stages that are close to production or are production. Thus, communications tend to be of most importance to production for transportation and wholesale levels in the marketing chain and least important for the levels closest to production agriculture.
The ratio of the combined share to communications alone (the data ratio) varies throughout Table 6-6. It is just above one for the industries in the list that are closest to production agriculture. It is also near one for agriculture, forestry, and fishery services. The ratio is 4.8 for water transportation and larger than 2.5 for transport other than motor freight, paper, textile mills, and fertilizers and chemicals. This suggests that in 1996 at least, computers tended to be most useful in production in transportation and least important in production agriculture. Since multipliers are static, it is important to realize that relationships may have changed significantly.
Table 6-7 looks at the amount of hypercommunications needed (or direct and indirect total requirement) to deliver one dollar's worth of output of the row industry to final demand at producer prices. The figures are not expressed on an input percentage basis as they were in Table 6-6. Instead, they are expressed as shares of output delivered to final demanders. If multiplied by 100, they become cents per dollar of output the industry requires from hypercommunications (the combined column) or communications alone to deliver output to final consumers. Total requirement coefficients may be broadly interpreted as proxies for communication up the distribution chain.
Multipliers can be easily used and abused [Beattie and Leones, 1993]. The addition of multipliers to obtain the combined share in the direct and indirect total requirements table does leave out some second-order effects that would result if convergence had actually occurred in the 1996 data or now for that matter. However, the methodology of Table 6-7 is similar to those used elsewhere to obtain backward and forward linkages of high technology [Charney and Leones, 1995; Devlin, 1995].
Table 6-7: Total (direct and indirect) communication requirements for
various agribusiness-related industries (per dollar of output delivered
to final demand).
Source: [Okubo, Lawson, and Planting, 2000, Table 5, Industry-by-commodity total requirements, pp. 66-72]
Table 6-7 shows that there is a positive correlation between the amount of processing an industry performs and the importance of communications. In Table 6-7, communications become more important to producers than in table 6-6. For example, the share of purchased hypercommunication inputs for air transportation is 2.8 cents, while for communications alone the share is 1.3 cents, a ratio of 2.15:1, suggesting that data communications are slightly more important to output than voice. For livestock and livestock products, the share hypercommunications contribute per dollar of output is 2.6 cents, while for communications alone the total is 1.6 cents, a ratio of 1.63:1. Transportation and wholesale trade still dominate the top position (again the rank by combined share), while agribusinesses in the stages closest to production show lower combined and total requirements. For air transportation, the combined amount (proxy for hypercommunications) is 6.5 cents while the communications-alone amount (proxy for voice communications) is 2.3 cents.
It is evident from Table 6-6 and Table 6-7 that, even in 1996, computers and communication were responsible for at least 1.4 cents per dollar of the total requirements for the lowest ranking industry, other agricultural products. In comparison to an input basis, where the total was less than half a percent, this is an important difference. That difference is more pronounced for livestock products. For producers, communication enters the value chain as goods move up towards final demand. It is uncertain how trends such as precision farming might alter this for non-livestock agricultural products.
Ratios of the combined requirement to the communications requirement (data ratios) tend to be lower for stages closest to production. The data ratio, when compared to those calculated in Table 6-6, suggests that data communications have more importance as output requirements than as inputs. It is possible to obtain a single number that suggests the downward or upward importance within the marketing channel for each industry by forming a ratio of all entries in Table 6-6 to all entries in Table 6-7.
The result, Table 6-8, has a simpler interpretation. Since Table 6-7 shows the upward channel linkages of hypercommunications and Table 6-6 shows the backward linkages, taking a ratio of all the values in each table identifies which direction linkages prevail for each industry. (Industries are listed alphabetically.) For example, livestock and livestock products has the highest value in the first column, 9.0. That was calculated by taking the 0.026 from table 6-7, converting it to percent of output by multiplying by 100, and then dividing by 0.288 percent of input from table 6-6. The result suggests that for the livestock industry, combined communication linkages going up the marketing channel are more important than they are going downward.
Table 6-8: Ratio of upward to downward communications in various agribusiness-related
industries
| Industry description | Combination ratio (up >1) | Communication ratio (up >1) | Data ratio (up >1) |
| Agricultural chemicals and fertilizers |
2.9
|
4.5
|
0.6
|
| Agricultural, forestry, and fishery services |
1.5
|
1.0
|
1.5
|
| Air transportation |
1.0
|
1.1
|
0.9
|
| Apparel |
5.2
|
4.4
|
1.2
|
| Eating and drinking establishments |
1.7
|
1.7
|
1.0
|
| Fabrics, yarn, and thread mills |
3.8
|
5.5
|
0.7
|
| Food and kindred products |
5.2
|
6.6
|
0.8
|
| Forestry and fishery products |
5.4
|
4.5
|
1.2
|
| Livestock and livestock products |
9.0
|
5.7
|
1.6
|
| Lumber and wood products |
3.7
|
4.1
|
0.9
|
| Miscellaneous fabricated textile products |
3.5
|
3.0
|
1.2
|
| Miscellaneous textile goods and floor coverings |
3.0
|
3.2
|
0.9
|
| Motor freight transportation and warehousing |
1.5
|
1.2
|
1.3
|
| Other agricultural products (non-livestock) |
2.9
|
1.9
|
1.5
|
| Paper and allied products, except containers |
2.3
|
3.1
|
0.8
|
| Paperboard containers and boxes |
3.3
|
3.3
|
1.0
|
| Pipelines, freight forwarders, and related services |
0.6
|
0.7
|
0.9
|
| Railroads and related services |
0.7
|
0.8
|
0.9
|
| Retail trade, general |
0.6
|
0.6
|
1.0
|
| Tobacco products |
1.7
|
2.2
|
0.8
|
| Water transportation |
3.8
|
7.6
|
0.5
|
| Wholesale trade, general |
0.5
|
0.5
|
1.1
|
The figures in Table 6-8 help in understanding whether forward or backward communication linkages are most important at particular levels of the marketing chain. Numbers lower than one are italicized to isolate cases where downward communications linkages are more important that upward linkages. Food and kindred products have the highest communications alone ratio of upward to downward. Wholesale trade has the lowest of both ratios, with 0.5, suggesting that these businesses have a greater requirement for communications to search for and buy products than to transport them to final demanders.
The last column, the data ratio of Table 7-8, is a ratio of the data ratio in Table 6-7 to the data ratio in Table 6-6. This number may help isolate the direction of data communications for a particular industry. Ratios below 1.0 (suggesting a predominance of downward communication) are italicized. For example, agricultural chemicals and fertilizers have a data ratio of 0.6, meaning that data communications represent a greater share of intermediate input purchases than they do of producer value at sale. This is in spite of the fact that communications show a considerable upward skew, with a ratio of 4.5. This appears to make sense if chemical manufacturers use data communications and computers for horizontal or downward communications, perhaps for supply ordering, tracking, mixing, etc. However, since agricultural chemicals are an information intensive industry due to environmental, health, and safety concerns, the overall direction of communications is up the supply chain towards users. The combined share ratio tends to cancel these opposing directions out.
In addition to varying according to stages of the marketing channel, there is some evidence from the multiplier data that the need for hypercommunication varies by input and product characteristic. This becomes the next topic.
6.3.5 Specific Needs Based on Specific Inputs, Crops, or Product Characteristics
Hypercommunication needs also depend on the inputs needed by an agribusiness, based on specific crops it produces or handles, and on general product characteristics. Hypercommunication needs based on where specific inputs come from are especially important to operations or levels of the marketing chain that add little value. Agribusinesses that have no market power must take whatever prices the market sets for output. However, the cost of inputs (also outside of control) can make up such an important part of overhead that firms become caught in a cost-price squeeze.
Hypercommunication technologies such as the Internet and EDI (Electronic Data Interchange) have the potential to lower transaction costs for inputs, enlarge the potential number of suppliers an agribusiness can choose from, and promote channel collapse. However, these positive network effects are not automatic. First, they can only be taken advantage of by organizations with the infrastructure, CPE, and information-literate employees needed for implementation. Second, it can be hard for an agribusiness to tell whether hypercommunications will be useful because implementations can be complex [Kaefer and Bendoly, 1999]. Finally, the benefits may be internalized by key suppliers who require customers to use systems as when retailers require grower-shippers or processors to use a particular system to do business with the retail operation.
The potential of new forms of supplier coordination through hypercommunications can be estimated by using BEA direct requirements coefficients (along with prevailing communications directions from Table 6-8) for six general agribusiness categories in Table 6-9 through Table 6-15. By looking at the top sources of inputs on a general industry basis, some observations can be made regarding B2B hypercommunication needs for a particular industry along with possible changes in input markets that might be brought about by hypercommunications.
Livestock and livestock products (shown in Table 6-9) include dairy, beef, and poultry in Florida, along with the horse industry. This industry has the smallest value added of the six analyzed here, meaning that margins are likely to be tight and there is a need to squeeze out cost savings when possible.
Table 6-9: Hypercommunication needs and related market
implications of the top five input sources, livestock and livestock products
| Intermediate input source | Input share (%) | Hypercommunication needs, market implications |
| Other agricultural products |
31.1
|
B2B, better logistics |
| Food and kindred products |
21.4
|
B2B, better logistics |
| Livestock and livestock products |
10.9
|
Horizontal-vertical integration (Intranet, VPN), Horizontal-vertical coordination (producer associations, virtual networks, Internet), online auctions. |
| Wholesale trade |
6.4
|
B2B and channel collapse |
| Real-estate and royalties |
5.1
|
Some additional liquidity of land |
| Top 5 intermediate inputs |
74.9
|
Overall: feedlots and packers main beneficiaries due to size, integration |
| Other intermediate inputs |
20.0
|
|
| Value added by sector |
5.0
|
Source: [Okubo, Lawson, and Planting, 2000, Table 3, Commodity-by-industry direct requirements, pp. 66-72]
Table 6-9 suggests that the livestock industry obtains almost three-quarters of inputs from the top five listed sources. Overall benefits of hypercommunications may flow to larger, vertically and horizontally integrated firms through improved logistics and modest cost savings on inputs. However, delivery of feed and other agricultural products such as hay and grain, are highly dependent on shipping costs so that even large producers may not be able to shave much off of costs. In the beef sector, the Internet is becoming more important for seedstock operations as a method of displaying photographic information about breeding stock, availability, and details about breed benefits and the seedstock operation. Vertical and horizontal coordination (even among smaller producers) is helped by the Internet as well, though communication is of small importance in production. Highly concentrated operations such as dairies or the poultry industry (where production contracts are especially important) are beginning to see farm-to-wholesale data networks that keep track of many variables on a real-time basis [ERS, "A Close-up of Changes in Farm Organization", 2000].
Table 6-10: Hypercommunication needs and related market
implications of the top five input sources, other agricultural products
(non-livestock)
| Input source | Input share (%) | Hypercommunication needs, market implications |
| Real estate |
8.7
|
Internet may widen market size, better information about properties, prices could lead to greater liquidity. |
| Agricultural fertilizers and chemicals |
7.3
|
Internet allows detailed information to be available online, channel collapse. |
| Agricultural, forestry, and fishery services |
6.8
|
Varies. Some services might vanish; others can compete and deliver via Internet. |
| Wholesale trade |
4.8
|
Coordination (Extranet), integration (Intranet, VPN) |
| Other agricultural products (non-livestock) |
2.9
|
Integration (Intranet), horizontal coordination (Internet, VPN), vertical coordination (Extranet) |
| Top 5 intermediate inputs |
30.5
|
Overall: Small cost savings on volume purchases, more price shopping, more choice of suppliers, channel collapse. |
| Other intermediate inputs |
13.2
|
|
| Value added by sector |
56.2
|
Source: [Okubo, Lawson, and Planting, 2000, Table 3, Commodity-by-industry direct requirements, pp. 66-72]
Other agricultural products (Table 6-10) include the production, assembly, and grading and classification stages in the agricultural marketing chain. Downward communication linkages of hypercommunications are limited in this sector, with the exception of small cost savings for volume purchasers, more ability to price shop, a greater number of suppliers to choose from over a larger area, and channel collapse [Frauenfelder, 1999]. However, even though communications may be more important for marketing (as mentioned in 6.3.4 regarding single location, single marketing stage operations), the dependence on output price means savings on inputs are important.
Table 6-11 features forestry and fishery products. The importance of services to this industry could mean cost savings for doing business via networked hypercommunications. However, the high geographic concentration of forestry producers due to transportation realities could limit the ability to save on inputs if inputs must come from nearby. Seafood processors may benefit from lower input costs, increased choice due to Internet and channel collapse.
Table 6-11: Hypercommunication needs and related market
implications for the top five input sources for forestry and fishery products
nationally
| Input source | Input share (%) | Hypercommunication needs, market implications |
| Agricultural, forestry, and fishery services |
25.0
|
Integration (Intranet, VPN), coordination (Extranet or Internet), impact depends on information-content and geographical concentration of service firms. |
| Food and kindred products |
4.6
|
Possibility of direct purchases (channel collapse), Extranet (coordination) |
| Forestry and fishery products |
3.3
|
Integration (Intranet, VPN), horizontal coordination (Internet), vertical coordination (Internet, Extranet) |
| Maintenance and repair construction |
2.8
|
Unknown |
| Legal, engineering, accounting, and related services |
2.5
|
Many such services can be delivered cheaply and effectively via communication networks. |
| Top 5 intermediate inputs |
38.2
|
Overall: High geographic concentration may limit importance, some savings on inputs, coordination, and integration due to networking. |
| Other intermediate inputs |
54.9
|
|
| Value added by sector |
45.1
|
Source: [Okubo, Lawson, and Planting, 2000, Table 3, Commodity-by-industry direct requirements, pp. 66-72]
Table 6-12: Hypercommunication needs and related market
implications for the top five input sources for agricultural, forestry,
and fishery services nationally
| Input source | Input share (%) | Hypercommunication needs, market implications |
| Other agricultural products |
11.0
|
Lower search costs for materials. |
| Agricultural fertilizers and chemicals |
8.2
|
B2B Internet, channel collapse. |
| Wholesale trade |
3.1
|
Channel collapse from e-commerce. |
| Livestock and livestock products |
2.3
|
Unknown. |
| Legal, engineering, accounting, and related services |
1.4
|
Prices could fall due to lower cost of electronic delivery |
| Top 5 intermediate inputs |
26.0
|
Overall: Information input prices fall, lower search costs for materials. |
| Other intermediate inputs |
13.3
|
|
| Value added by sector |
60.7
|
Source: [Okubo, Lawson, and Planting, 2000, Table 3, Commodity-by-industry direct requirements, pp. 66-72]
Table 6-12 shows agricultural, forestry, and fishery services. Inputs for services firms are relatively less important since this category has the highest value-added of the six examined. Additionally, horizontal communication needs are lower than with other categories. To the extent that such services buy information inputs from the listed sources, hypercommunications is important. The largest agricultural, forestry, and fishery service businesses are landscape and horticultural businesses, followed by veterinary services, and then other animal services [U.S. Census, County Business Patterns, 1998].
Table 6-13 shows the input requirements of the food and kindred products industry. Food and kindred products include dairy processing plants, fruit and vegetable processors, bakeries, sugar refineries, and beverage plants. Together, these operations comprise the middle of the food distribution channel. Food and kindred products firms have the highest intra-industry input requirement share of all six industries studied here.
Table 6-13: Hypercommunication needs and market implications
for the top five input sources of the food and kindred products industry
nationally.
| Input source | Input share (%) | Hypercommunication needs, market implications |
| Livestock and livestock products |
17.3
|
Lower price risk, supply instability from better risk management tools and information, channel collapse. |
| Food and kindred products |
16.0
|
Coordination (Internet, Extranet), Integration (Intranet, VPN), channel collapse. |
| Other agricultural products (non-livestock) |
8.7
|
Lower search costs, greater search scope, channel collapse. |
| Wholesale trade |
6.5
|
B2B, channel collapse, new vendors. |
| Advertising |
2.5
|
Addition of web advertising to media budgets. |
| Top 5 intermediate inputs |
51.0
|
Overall: data communication is more directed downward. |
| Other intermediate inputs |
20.2
|
|
| Value added by sector |
28.8
|
Source: [Okubo, Lawson, and Planting, 2000, Table 3, Commodity-by-industry direct requirements, pp. 66-72]
Food and kindred products firms face instability from two directions. They face commodity price and quantity risks from producers as well as demand risk from consumers. While commodity quantity and price risk are important in downward communications with suppliers, unexpected recent downward trends in retail food demand have led firms to spread their demand risk downward by specialization and new vertical arrangements [Reed and Clark, 2000]. Thus, relationships with input suppliers help those in the middle of the food distribution system share supply and demand risks.
Hypercommunications can be important in this process of spreading risk. Voice communications tend to be most useful for communicating up the supply chain, while data communications are important to downward communications. Raw commodities and ingredient purchases represent the top three sources of inputs. However, commodities are increasingly taking on characteristics of branded products as they move up the chain. For example, retail demand in the produce market has increased the importance of year-round varieties, pre-cut produce, and specially packaged or branded commodities [ERS AIB-758, 2000]. Thus, middlemen and processors have to cooperate more closely to find suppliers worldwide, get information about quality and price, and improve information about risk.
One way firms are coping with risk is by widespread consolidation and channel collapse [ERS, AIB-758, 2000; Reed and Clark, 2000]. This has two important effects. First, larger, more consolidated firms may be better able to afford hypercommunications. However, even while mergers and consolidations may make internal communications more important, difficulties with merging incompatible networks of previously separate entities can be enormous. Hence, IP technology such as Intranets, converged VPNs, and similar standardized approaches to communication may become more attractive than more expensive, less compatible custom private data networking solutions.
The last category to be considered is the agriculture fertilizer and chemical industry shown in Table 6-14. Products from this industry are important inputs in two other categories as shown by Table 6-12 and Table 6-10. Production in this industry is a highly technical, potentially dangerous undertaking. Information about the origin, history, and source of ingredients are especially important as is keeping a steady stream of inputs flowing for orderly production.
The top sources of inputs in the sector are from within the industry, while the second largest source is from other chemical firms. Again, data communications tends to be more important to purchasing inputs rather than selling products, though the reverse seems to be true for voice. Converged networks would help avoid having to have dual capacities, saving firms money on communication costs. Additionally, since information is generally so important vertical cooperation with suppliers through Internet and Extranet solutions can lead to savings of money, better information flow, and, thus to reduce risk.
Table 6-14: Hypercommunication needs and market implications
of the top five input sources of the agricultural fertilizers and chemicals
industry nationally
| Input source | Input share (%) | Hypercommunication needs, market implications |
| Agricultural fertilizers and chemicals |
11.8
|
Information to document regulations, safety, and health are especially important. B2B for chemical ingredients, horizontal integration requires Intranet or VPN. |
| Industrial and other chemicals |
10.3
|
Vertical cooperation (Extranet), channel collapse. |
| Crude petroleum and natural gas |
7.3
|
Price instability can be helped with better access to exchanges. |
| Motor freight transportation and warehousing |
5.4
|
Communications needed for logistics support, Extranet with carriers. |
| Wholesale trade |
5.2
|
B2B, channel collapse, more possible vendors. |
| Top 5 intermediate inputs |
40.0
|
Overall: Data communication used more for input purchases than to deliver final goods. |
| Other intermediate inputs |
26.7
|
|
| Value added by sector |
33.3
|
Source: [Okubo, Lawson, and Planting, 2000, Table 3, Commodity-by-industry direct requirements, pp. 66-72]
Another group of needs is based on specific customer and product characteristics. Table 6-15 shows several factors that make hypercommunications especially worthwhile. One of the most important characteristics is the unit price of a sale or product. This has been especially true of the Internet, but likely will help usher convergence in for firms as well. A single customer who buys an expensive thoroughbred racehorse or property that was found on a website can pay the entire cost of website hosting and development. High-ticket goods can be featured using detailed descriptions, images, audio, and even video using hypercommunications to interest prospective buyers without the need to invest time and money qualifying buyers.
Participation in auctions and exchange markets (such as futures markets) is enhanced by interactive, real-time communications with a variety of message types. Experiential goods such as tourism may require that retail customers have plenty of information about the facility or tour before making a reservation. An illustrated web site with plenty of detail about accommodations, food, etc. is increasingly important. Complicated order processes can be controlled and explained to customers in a uniform manner via e-commerce sites, for example. However, it is important to heed the advice given in 4.9 regarding web design and e-commerce, because a poorly designed, poorly tested site at on an overcrowded server provides headaches rather than benefits.
Most services (especially information-intensive ones) favor the use of hypercommunications. It is easier for agribusinesses to hire attorneys, accountants, brokers, and others at the best price if they have a large choice. Easily shipped products are another example of a product characteristic that makes hypercommunications more important to agribusinesses. Logistics such as scheduling and tracking can be automated and made available to customers and employees. Complicated products on the seller's end (that require logistical support) or on the buyer's end (that solve problems) increase the importance of hypercommunications networking.
Business computer needs are often separated by Microsoft into FrontOffice (sales and marketing) and BackOffice (support and administration) needs. Data intensive or time consuming operations for both cases can be outsourced to a service company that specializes in payroll or order fulfillment, for example. Outsourcing frees the agribusiness to focus on its business or to handle sudden seasonal business changes without hiring permanent help, but requires communications to transmit and receive data as well as to monitor outsourcing quality. Customer needs that merit greater hypercommunication needs also include complicated products, consumers with high (or specialized) information needs, price shoppers, search goods, and international trade. These latter customer characteristics given in Table 6-15 should be self-explanatory.
Table 6-15: Customer or product characteristics that increase
the importance of hypercommunications
| Characteristic | Agribusiness examples (hypercommunication advantages) |
| High unit price of item | Real estate, horses, breeding stock. (Pre-qualify prospects at low cost.) |
| Auctions, exchange markets | Internet auctions of cut and live flowers, landscape plants, animals, soybeans. (More efficient markets.) |
| Experiential goods | Agri-tourism, eco-tourism, recreational tourism. (Pre-qualify prospects, sales.) |
| Complicated order processes | Automation of complicated ordering processes without using agribusiness labor. (Avoidance of mistakes.) |
| Services | Sales agents, lawyers, accountants, public relations. (Larger pool to choose from.) |
| Easily shipped products | Expansion of market area has fewer limits with cheaper, global communications. (Savings in time and money spent on travel, shopping.) |
| Scheduling, tracking, logistics | Perishable shipments. (Information about where a shipment is, when it was sent or received, how long in transit, etc. promotes control.) |
| Problem solving goods and services | New technologies and processes that solve a problem but require information for customers to understand the concept. |
| BackOffice outsourcing | Payroll, bookkeeping, employment services, and other services free agribusinesses from time-consuming chores; can be purchased and monitored over Internet or Extranets. More choices exist as well since outsourcing vendor does not need to be nearby. |
| FrontOffice outsourcing, fulfillment services | Outsourcing ordering, shipping, other sales and marketing jobs to a specialized firm to handle seasonal needs. (Agribusiness is freed to focus on core competency.) |
| Complicated product | Agricultural chemicals, technologies. (Provide uniform, accurate information about safety and use.) |
| Customers with high information needs | Some customers prefer to have multiple methods of communications. Others will only buy or communicate via web, fax, telephone. (Serve customers they way they like.) |
| Price shoppers | Businesses that compete on price. (Pricebots can be programmed to search for the lowest price of any good or service on the Internet. Price conscious customer needs met) |
| Search goods | Recall these need not be high-ticket goods alone. Retail examples include: food safety, nutrition, organics, humane production, biotechnology, kosher, specialty items. |
| International target market | Ability to translate languages automatically, communicate inexpensively worldwide. (Source of new customers.) |
Other hypercommunication needs are based (or will be) on specific crops. While this subject is too involved to treat in detail here (since each crop may use different parts of the same marketing channels or crop complex), it is possible to summarize two points. First, the relative importance of various crop complexes to Florida's total agribusiness complex can be approximated. Second, a few general observations can be made about how hypercommunications will influence agribusinesses dealing in specific crops.
On the first point, the extent and composition of the agribusiness hypercommunications market, both Figure 6-22 and Figure 6-23 provide a breakdown of the contribution made by segments of production agribusinesses to cash receipts [USDA NASS-FASS, "Farm Cash Receipts and Expenditures", August 2000]. Under this first definition of production agriculture, citrus is the largest sector in cash receipts, followed by vegetables and melons, livestock, and field crops.
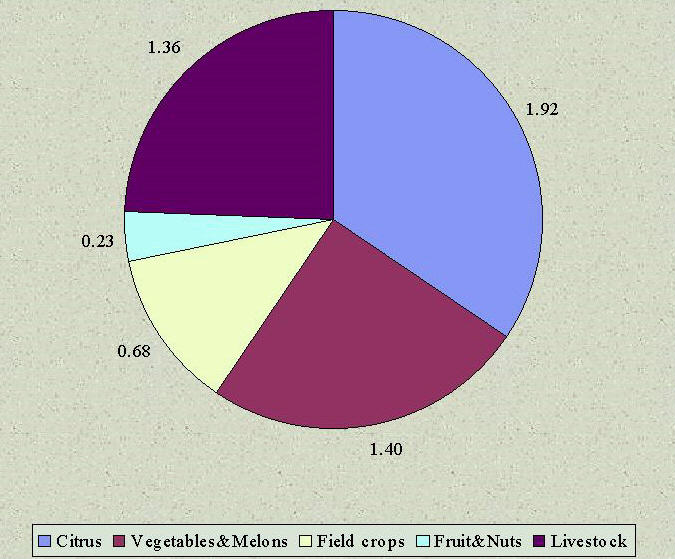
Figure 6-22: 1999 Cash receipts by category under traditional definition of production agriculture (billions of dollars).
However, the traditional definition of production agribusiness (shown in Figure 6-22 and shown in Figure 6-23 as definition one) excludes nursery and greenhouse crops. The nursery and greenhouse sector (which also includes sod and mushrooms) includes two main categories: first, foliage and floriculture, and second, greenhouse, mushrooms, and sod. Foliage consists of interior plants, while floriculture includes fresh flowers and cut flowers. When included in the total, nursery and greenhouse crops are almost as important as citrus to producer cash receipts statewide. They are especially important to South Florida and the Orlando area as Table 6-2 showed in 6.3.1.
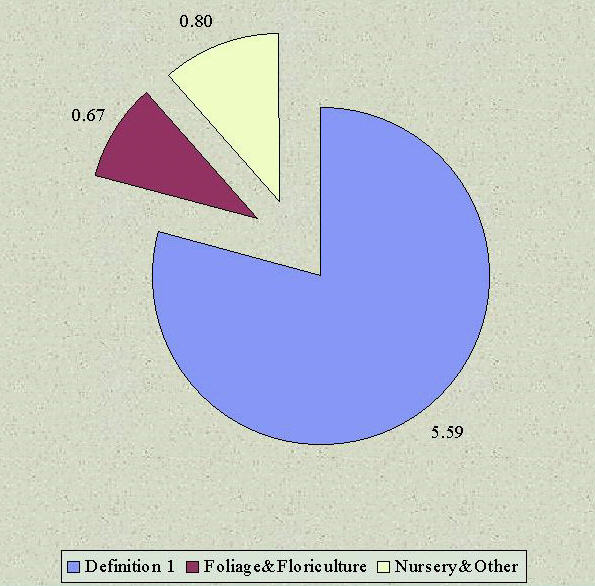
Figure 6-23: 1999 Cash receipts of nursery and greenhouse production not included in the traditional definition of production agriculture (billions of dollars).
Table 6-16 provides a further breakdown of producer receipts by specific crop (ranked in order of 1999 cash receipts).
Table 6-16: Possible hypercommunication implications on
specific crop sectors in Florida
| Crop or livestock sector | Production receipts, 1999
($ Mil.) |
Impact of hypercommunications on crop sector (websites with more information) |
| Citrus | 1,920 | Possible channel collapse, increased risk management tools for growers, processors. (www.ultimatecitrus.com) |
| Nursery, greenhouse, sod | 1,459 | New ways to communicate rapidly changing prices and availabilities, segregated by wholesale and retail customers. (www.growit.com, www.findplants.com, www.zone10.com, www.pbwga.com) |
| Sugarcane | 520 | Perhaps minimal due to concentration, increasing vertical integration. (www.ussugar.com) |
| Timber harvest | 430 | Most important at processor and product level. (www.timber.org, www.afandpa.org) |
| Milk | 411 | Important for input purchases, communication among producers. (www.dairybusiness.com). |
| Other vegetables and melons | 399 | Greater importance of branding, organics, retail slotting allowances, and channel collapse. (www.BuyProduce.com) |
| Tomatoes | 392 | Similar issues with other perishables. (www.agex.com's www.tomatoex.com has been introduced as an online tomato exchange). |
| Seafood landings | 390 | Most important for recreational boating or processors. (Independent trading exchange www.seafood.com, boat and equipment purchases www.marineweb.com) |
| Poultry and eggs | 355 | Makes it easier for poultry companies to monitor and enforce production contracts at producer level. (www.eggs.org) Favorite target of animal rights advocates. |
| Cattle and calves | 310 | Varies by size of operation and marketing level. Important for B2B input purchases, information for producers, communications among producers. (www.cattleinfonet.com, home of online video cattle auctions) |
| Green peppers | 225 | Similar to vegetables and melons. (www.TradingProduce.com) |
| Field crops other than sugar | 165 | Most important at broker levels and above. (www.peanutusa.com) |
| Snap Beans | 155 | Similar to vegetables and melons. Associations important, such as FFVA (www.ffva.com). |
| Strawberries | 151 | Similar to other perishables. (www.straw-berry.org |
| Potatoes | 124 | Producer source of information, increasing importance of biotechnology. |
| Horses and mules | 114 | Diverse mix of small operations, recreationalists, thoroughbred farms with their own needs. Non-feed input purchases increasingly important and international. (www.horseweb.com) Information needs of horse owners. |
| Sweet Corn | 106 | Similar to vegetables and melons. |
Sources for receipts: USDA NASS-FASS, "Farm Cash Receipts and Expenditures", August 2000, Bureau of Seafood and Aquaculture Marketing, 1999; DOACS, Florida Agricultural Facts, 1999, p. 71
The table provides only a broad first approximation of the overall importance of each crop complex to Florida agribusiness as a whole. This is because each has a unique entire marketing channel. For example, some crops grown in Florida are processed outside of Florida, while others are grown in other states (or internationally) and processed here. The relative importance of receipts helps to focus attention on what crop complexes gives some hypercommunication implications for the top crop complexes.
Details for most of the points above have been explained more fully in previous sections, but are summarized in the table to underscore that the impact of networked hypercommunications affects specific Florida crop sectors differently. A few general observations are in order. The importance and effect of hypercommunications on a crop sector is related to the total number of producers or firms, the variety of crops within the sector, and the number of uses and customers. For example, there are far more horse owners than snap bean farmers nationally as well as in Florida, so there is more overall information. Snap beans share their market chain with other vegetables while the recreational horse market, thoroughbred farms, feed, and tack, veterinary specialties, stalls, corrals, insect control and other items are a whole complex of products directed to the horse.
For several crop sectors, web sites that represent the implications of hypercommunications are included that will be better sources of specific examples. Among those listed in Table 6-16 are sites where farmers meet and communicate, sites where wholesale and retail customers can order products and get prices. Others are completely new forms of electronic markets where video auctions and real-time interactive bidding, occur and availabilities are announced. Even within crop sectors, some hypercommunication needs depend on how large an agribusiness is and how large its marketing is or can become.
6.3.6 Needs Based on Firm or Sector Size and Marketing Area
As firms grow in size, the amount of information coming in and going out rises to the point that new employees must be hired in order to keep up. Under such an information-employee growth cycle, unless new telephone lines, faxes, and computers are bought (along with an expansion in the number circuits), there will be a loss in productivity per employee. Information exchange and management control using hypercommunications can allow producers to manage larger operations than previously thought possible until computer networks allowed unified control of Front Office and Back Office operations over distances that had been previously technological infeasible.
One of the main indicators of needs is the number of employees per firm. Some specific effects of firm size on hypercommunication costs are covered in Chapter 7. Of course, size is related to horizontal and vertical integration as was covered in 6.3.4. However, hypercommunications is important for several kinds of firms for size-related issues as shown in Table 6-17.
Table 6-17 summarizes hypercommunication needs based on firm size, sector size, or marketing area. Firms such as Dole and Del Monte use hypercommunications to control agricultural product form through channels they own over time. They also are most likely to be multinational operations with enormous overseas operations, a large number of divisions, and tens of thousands of employees. However, the needs listed in table 6-17 do not require a multinational size. In fact, that is one of the revolutionary things about information technology and hypercommunications. Technical change is proceeding at such a breakneck pace that costs of many technologies are changing exponentially for the better, even as their prices drop considerably.
Table 6-17: Hypercommunications as an important tactic
to achieve goals or fill needs based on firm size or marketing area
| Need or goal | Examples | Action |
| General expansion of marketing footprint | Passive expansion: firm enters new territories, seeks global e-business trade. | Web-site, e-commerce, Extranet with new suppliers |
| General expansion of sales staff, locations, employees | Active or aggressive expansion: firm hires new employees, builds new locations, plants. | VPN, Intranet, private data networking, CTI |
| Increase sales per existing customer | Goal to serve existing customers better. Possible special treatment for customer s-groups. | Extranet used to tie larger, existing customers much better, discounts for web site purchases, |
| Increase in foreign sales or purchases | Desire to serve Mexico, Caribbean, Africa, Asia, Europe | Possibility that some communication may have to be in foreign language. Web sites can be automatically translated. |
| Foreign language needs | New exporter | International communication alone or with shipper agent |
| Large firm's desire to implement more knowledge-based, research-oriented, innovative firm. | Biotechnology firm that needs to enter agriculture in addition to medicine. | Research and development, organizational information policy, CIO, CTO. |
| E-commerce, CTI, state of the art order center | Business needs to consolidate equipment bought at different times, by different people, for different departments into something generally useful. | Hire (and use) the advice of a qualified person responsible for telephones, computers, Internet, the website, etc. RFP the project. |
| Interact with large number of buyers and sellers on routine, repetitive transactions. | Employees (and customer employees are spending too much time working on details and errors in paper forms, often written in different locations, under different circumstances. If firm does not outsource, it needs to buy, install, train, and use database packages on computers both at home office and elsewhere. | EDI, Internet, Extranet. Make sure database program is compatible with firms you trade with before buying. |
For larger international agribusinesses, the Internet and private data networking are already responsible for decreases in the firm's outlay on substitutes such as international and domestic communications costs (including travel, telephone, fax, postal delivery services, and advertising). Hypercommunications provide better management control of far-flung operations and superior customer service for information-savvy large clients. Unit costs for hypercommunications are expected to continue to drop thanks to deregulation, but the quality, capacity, and failure rate of hypercommunications technologies and services differ substantially.
Firms may also purchase new technology (while holding employee numbers constant) in the hopes of becoming more productive. This move is usually rewarding only when adequate time is taken to train staff on new equipment. Typically, in seasonal agribusinesses the slow time of year should be chosen if possible.
Chapter 6 has focused on market boundaries, agribusiness
hypercommunication needs, and the units of hypercommunications. Hypercommunications
can be inconvenient to buy because of the irregular boundaries among providers
(markets with POPs where access is sold) and transport sales are highly
dependent on fiber optic infrastructure. However, today's transport will
be tomorrow's access (data rate and bandwidth). If the problem with market
boundaries is not bad enough, the products are defined in different ways
between companies and even inside companies in many cases. Most unique
hypercommunications come from characteristics of agriculture which, when
taken together, make agribusiness communication needs more diverse than
many would imagine by thinking only of farming. This is especially true
in Florida. Now, two final topics are covered in the last chapter, Chapter
7. First, "From whom?" will agribusinesses buy hypercommunications
and "How much?" will they cost.